

Farmers and advisors are able to analyse current and past climate records at any given location using the CliMate app, a climate tool developed for the Managing Climate Variability program.
The app, which uses data from the Queensland Government’s SILO climate database, enables users to understand climate drivers and access one of the 10 separate tools within it including:
- How’s the season?
- How often?
- How wet/nitrate?
- Yield potential?
- Drought?
- How hot/cold?
- How likely?
- How’s El Nino?
- How’s the past?
- What trend?
Each tool is useful at the relevant time of the year and location. However, the standout tools which will be of use now are the ‘How’s the season?’ and ‘How often?’ tools.
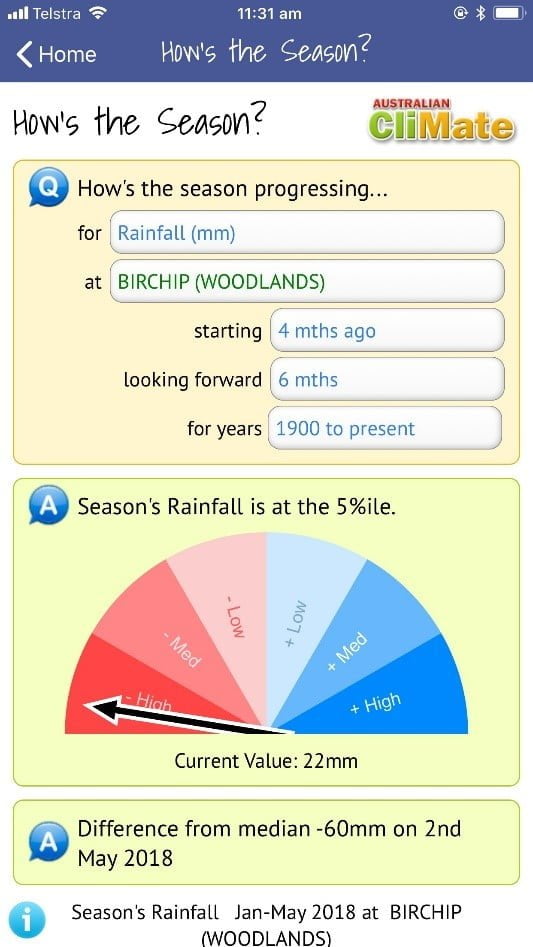
How’s the season?
This tool assists you to investigate rainfall, temperature and radiation at a given location and how this compares to other seasons.
In figure 1, taken on 26 April 2018, the location of Birchip has been selected for rainfall. This is a comparison between rainfall recorded for 2018 and all other years of data since 1900.
As can be seen in the figure, Birchip has only received 22mm so far for 2018, which is 60mm less than the median value from 1900 to now.
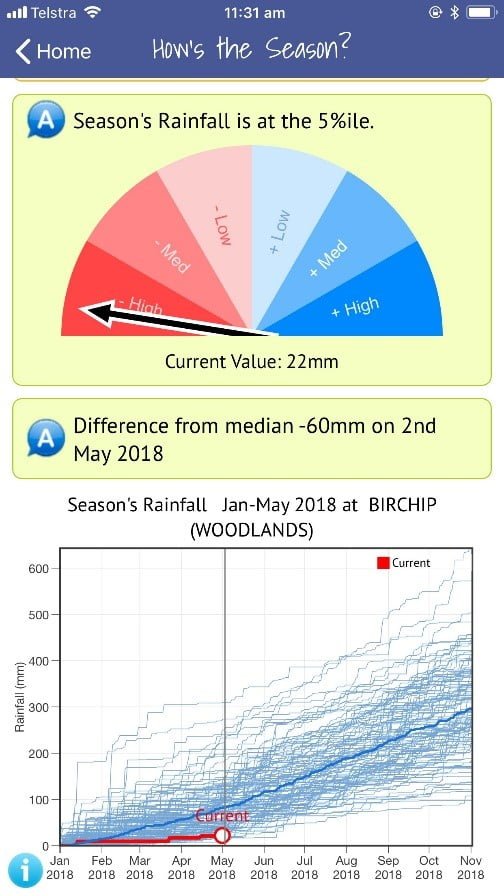
In figure 2, you can see how the season has been tracking compared to other years, with the red line indicating the current circumstances.
While this information can be somewhat sobering, it does highlight that growers have experienced seasons with lower rainfall.
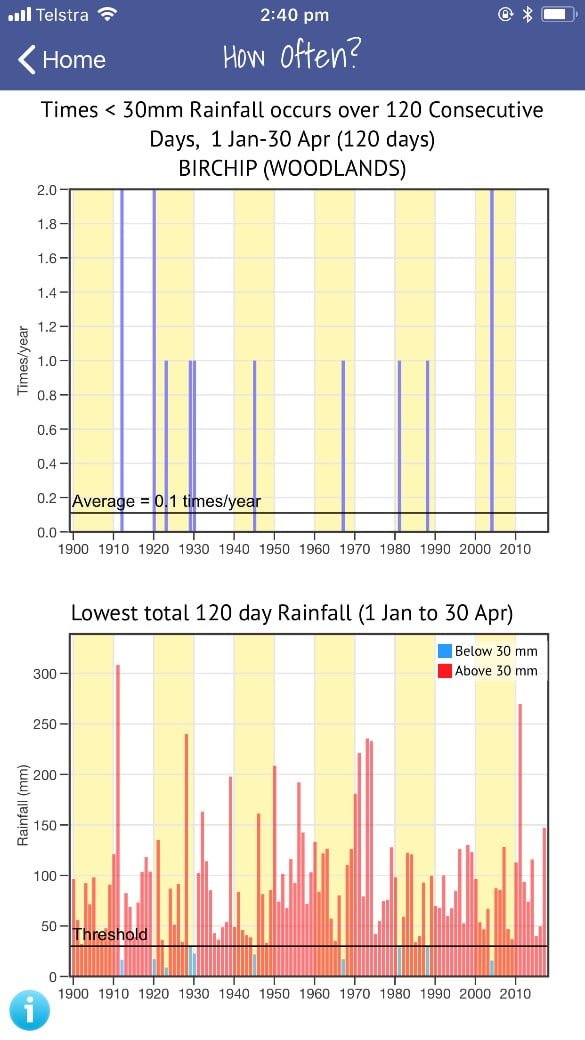
How often?
The How often? tool determines how often an area has experienced a particular rainfall, temperature or radiation number.
Figure 3 informs us that Birchip has experienced less than 30mm in 10 out of the last 118 years between 1 January and 30 April.
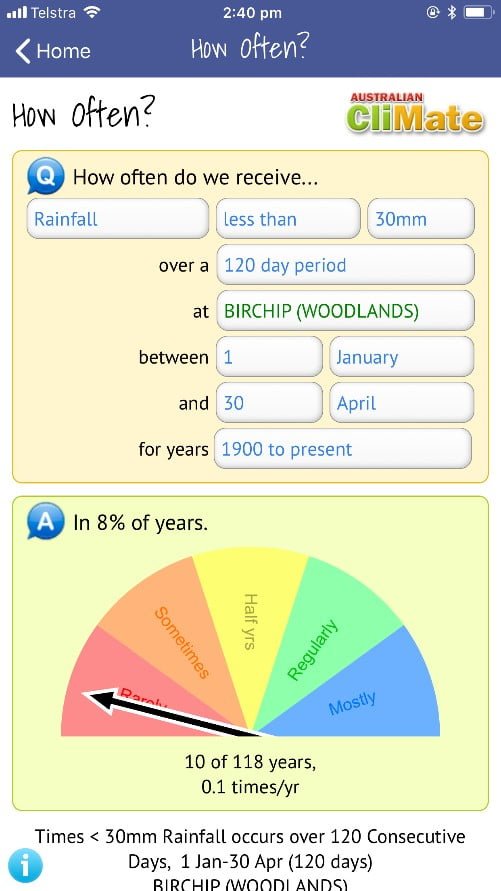
Figure 4 shows that the 10 years where there has been less than 30mm between 1 January and 31 April are 2004, 1988, 1981, 1967, 1945, 1930, 1929, 1923, 1920 and 1912.
 The below table indicates the state of the climate drivers in each of these years. As you can see, except for 1988, the general trend is for neutral, positive IOD or El Nino climate driver influence.
This is consistent with the messages being communicated by BoM and The Break.
| Year | Climate driver |
| 2004 | Positive IOD |
| 1988 | La Nina and negative IOD |
| 1981 | Nil |
| 1967 | Nil |
| 1945 | Positive IOD |
| 1930 | El Nino and negative IOD |
| 1929 | Nil |
| 1923 | Positive IOD |
| 1920 | Nil |
| 1912 | Nil |
The CliMate App can be used on both Apple and Android devices, and can be downloaded on either iTunes and GooglePlay. It is also available on desktop computer and can be found here.