TAKE HOME MESSAGES
- When sub-soil water is present, growing high value canola and legume break crops can be profitable in the Mallee.
- Where brome grass seed bank populations are high, break crop sequences of longer than two years are necessary to decrease numbers, and keep them down.
- The application of CLF herbicide chemistry is effective in reducing brome grass populations, but herbicide resistance will develop quickly if they are used repeatedly in the same paddock.
BACKGROUND
In 2011 and 2012, break crop sequences were compared with cereal sequences, some of which used Group B herbicide for brome grass control. In 2013 and 2014, consecutive wheat crops were grown and the profitability of the different sequences was compared.
In the Mallee, growing break crops has been perceived to be of greater risk than growing cereals, mainly due to higher input costs and the increased chance of crop failure. Over the four years of this study, summer rainfall in 2011, 2012 and 2014 was Decile 10, 9 and 7 respectively, while 2013 summer and GSR rainfall was Decile 3 and 4, just below average. This rainfall reduced the threat of crop failure when growing high input crops in the Mallee.
Prior to 2010, cereal dominant rotations led to an increase in brome grass populations. As a result, the use of Group B chemistry based on Clearfield technology increased substantially. This put severe pressure on Group B herbicides and the subsequent development of resistance. For both reasons, Clearfield options featured prominently in break choices in this crop sequencing research.
AIM
To determine the influence of break sequences (2011-2012) followed by consecutive wheat crops (2013-2014) on soil water, nitrogen, brome grass populations and profitability.
TRIAL DETAILS
2014
Location: Chinkapook
Soil type: Sandy clay loam without sub-soil constraints
Annual rainfall: 273mm
GSR (Apr-Oct): 155mm
Crop type: Mace wheat
Sowing date: 1 May
Seeding equipment: Knife points, press wheels, 30cm row spacing
Target plant density: 150 plants/m² (65kg/ha)
Harvest date: 17 November
Trial average yield: 2.3t/ha
TRIAL INPUTS
Fertiliser: Granulock Z @ 60kg/ha at sowing plus urea @ 90kg/ha top-dressed at GS30 (18 June)
Herbicides: Pre-sowing Glyphosate @ 1L/ha + TriflurX® @ 1.5L/ha + Avadex® Xtra @ 2L/ha In-crop LVE 600 @ 350ml/ha + Lontrel™ @ 100ml/ha + Hasten™ @1 %v/v
METHOD
A fully replicated field trial was sown using a completely randomised block design. From 2011 to 2012, fifteen different crop sequences of one and two year break crop options were investigated. One year break crop sequences were followed by three years of wheat, while two year break crop sequences were followed by two wheat crops (Table 1). Both options had no further brome grass control.
In 2013, wheat (Grenade CLF Plus) was grown on all treatments (no Clearfield herbicide was used) and in 2014 wheat (Mace) was grown to assess the influence of each crop sequence on soil water, nitrogen and brome grass populations.
Measurements included brome grass emergence from the seed bank, pre-sowing soil nutrition and soil water (0-10, 10-40, 40-70, 70-100cm), in-crop brome grass plant counts, grain yield and quality parameters. The productivity differences between each sequence were assessed by 2011-2014 yields and gross margin returns. Each year, local input and commodity prices were used and livestock on volunteer pasture were calculated at 2DSE/ha and medic at 2.7DSE/ha; a return of $30/head was assumed.
Table 1. 2011-2012 trial-set up crop sequences.
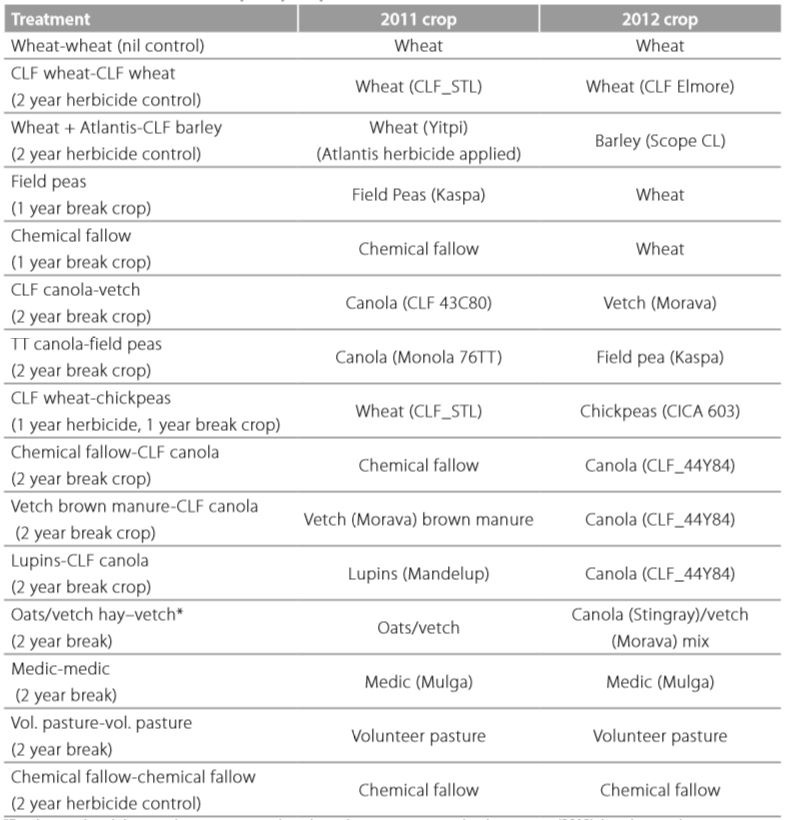
*For the oats/vetch hay-vetch treatment, vetch and canola were sown together in year two (2012), but the canola was outcompeted by the vetch which was harvested for grain.
RESULTS AND INTERPRETATION
Chinkapook rainfall
The 2011 season was excellent for crop growth, with both high summer and growing season rainfall. In 2012, summer rainfall was the driver for crop growth, as the GSR was only Decile 2. In 2013, summer rainfall was much lower (Decile 3) and neither weeds nor self-sown cereals emerged prior to sowing. In 2014, Decile 4 in-crop rainfall governed plant growth. Summer rainfall was again favourable in 2014 (Decile 7) and this, combined with excellent early rainfall in April set up yield potential for the 2014 season (Table 2).
Table 2. Chinkapook rainfall and deciles for 2011-2014.
.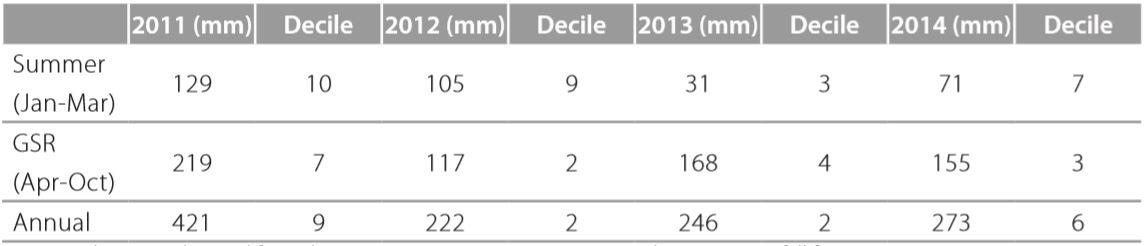
Note: Deciles were obtained from the ‘Rainman’ computer program using long-term rainfall from Manangatang.
Pre-sowing soil water (0-100cm)
In 2012, after one year of break options, higher summer rainfall resulted in pre-sowing soil water ranging from 186 to 219mm across all treatments (P <0.004, LSD =17mm, CV 5%). The lowest soil water content was after medic, CLF canola and lupins.
In 2013, after a relatively dry summer, the highest pre-sowing soil water (217mm) was the two year chemical fallow-chemical fallow sequence (P <0.001, LSD =19mm, CV 6%). The lowest soil water content (141-160mm) was in the field peas-wheat, CLF canola-vetch, vetch brown manure-CLF canola and chemical fallow-wheat treatments.
In 2014, there was no difference between treatments. Average pre-sowing soil water was 201mm.
The average water content for the three years was generally very high across the site, which decreased the risk of crop failure. To put the total water figures into context, the first 31mm of stored water at this site was deemed to be not available to wheat, consequently, 31mm should be subtracted from the moisture levels monitored above to estimate the amount of plant available water (PAW) to crops.
Pre-sowing soil mineral nitrogen (0-100cm)
In 2012, pre-sowing soil mineral nitrogen ranged from 84 to 131kg N/ha (P<0.001, LSD =19kg N/ha, CV 11%). Soil mineral nitrogen was greatest in the chemical fallow and vetch brown manure treatments. On average, these treatments had an additional 26kg N/ha compared to treatments with the lowest nitrogen levels (pasture, most wheats and lupins).
In 2013, soil mineral nitrogen ranged from 63 to 124kg N/ha (P<0.001, LSD =24kg N/ha, CV 18%). Chemical fallow-chemical fallow, vetch brown manure-CLF canola and TT canola-field pea sequences resulted in the highest soil mineral nitrogen. The lowest nitrogen sequence was chemical fallow-wheat but this did not differ significantly to a number of other sequences (63 to 84kg N/ha).
In 2014, pre-sow soil mineral nitrogen was the same across all sequences. Average pre-sowing soil nitrogen measured in 2012, 2013 and 2014 of 105, 86 and 48kg N/ha shows that consecutive wheat grown in 2013 and 2014 used more nitrogen than that applied.
The addition of nitrogen through a legume or fertiliser would be necessary for any subsequent crop: in 2014 the average site wheat yield of 2.3t/ha would have used 92kg N/ha and 95 kg N/ha was supplied, which does not leave any nitrogen in reserve.
Brome grass
In 2012 after one year of break options, the brome grass seed bank for wheat with no control contained the highest brome grass population of 971 plants/m2. The Wheat + Atlantis treatment also resulted in very high numbers (458 plants/m2) which is consistent with Atlantis being registered only for the suppression of brome grass. One of the chemical fallow treatments also had high brome grass numbers (329 plants/m2). This was unexpected, as other chemical fallow treatments did not have such high numbers. Spatial variation, header trails or poor herbicide application could explain this (Table 3).
By 2013, the brome grass seed bank population of the wheat with no control had increased to 1014 plants/m2. The two year herbicide breaks of wheat + Atlantis-CLF barley and CLF wheat- chickpeas, as well as the one year breaks of field peas-wheat and chemical fallow-wheat also had high brome grass populations (two wheat crops after the break crop). Brome grass control was most effective in the two year break sequences of vetch brown manure-CLF canola, medic-medic, volunteer pasture-volunteer pasture, lupins-CLF canola, chemical fallow-CLF canola, TT canola-field pea, CLF canola-vetch, oats vetch hay-vetch, where seed bank numbers decreased to 0-9 plants/m2.
The brome grass seed bank in 2014 increased substantially to 3458 plants/m2 in the wheat-wheat no control treatment. The one year breaks of chemical fallow-wheat and field peas-wheat increased to 1005 and 595 plants/m2 respectively. Where brome grass seed banks were lowest in 2013 (0-9 plants/m2), brome grass numbers increased to a range from 44 to 243 plants/m2 one year after wheat was grown with no brome grass control.
The 2014 in-crop brome grass numbers were much lower than the seed bank in July, mainly because of pre-emergent herbicide control and competition from the wheat crop. The lowest brome grass numbers were in CLF wheat-CLF wheat, vetch brown manure-CLF canola and lupins-CLF canola (4-8plants/m2). Wheat-wheat (no control), the two one year breaks and medic-medic had the highest numbers at (516-36 plants/m2). Medic was sprayed with Verdict® in 2011 but it was grazed in 2012 with no in-crop grass herbicide applied.
The results show that to decrease brome grass numbers in the seed bank, and to keep numbers down, break sequences of longer than two years are necessary.
Table 3. 2012, 2013 and 2014 brome grass seed bank (plants/m2) and 2014 in-crop brome grass (plants/m2).
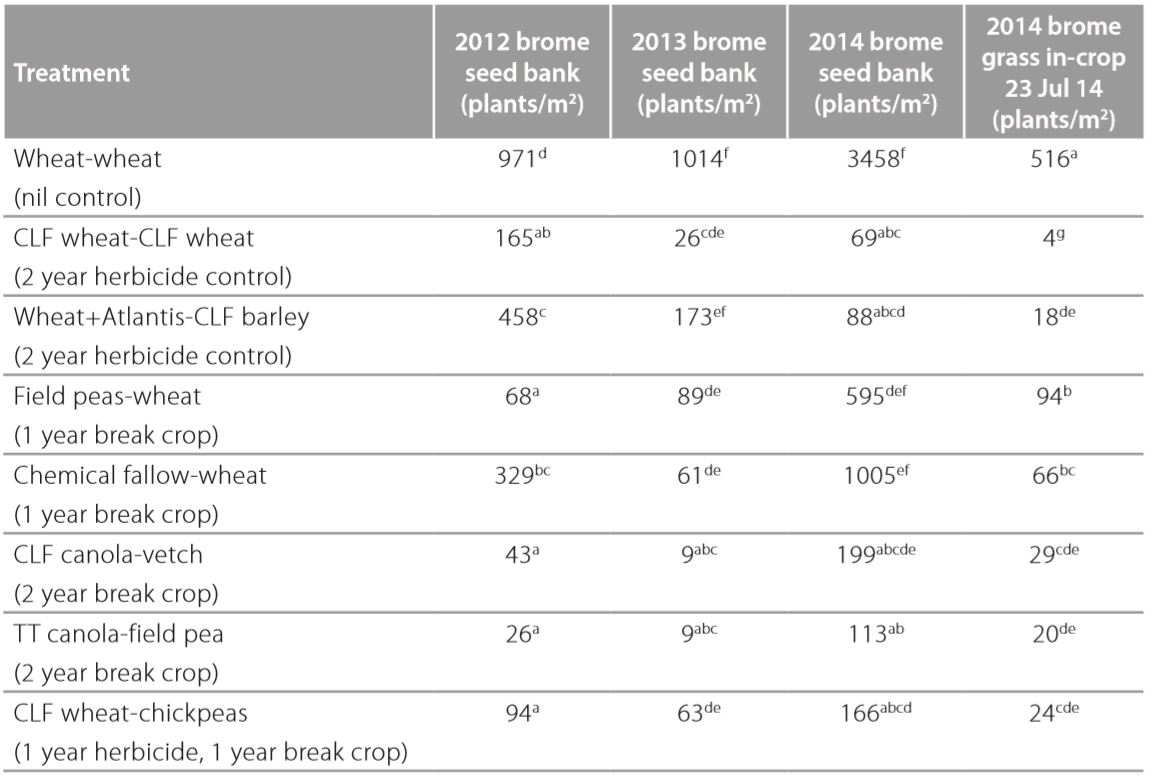
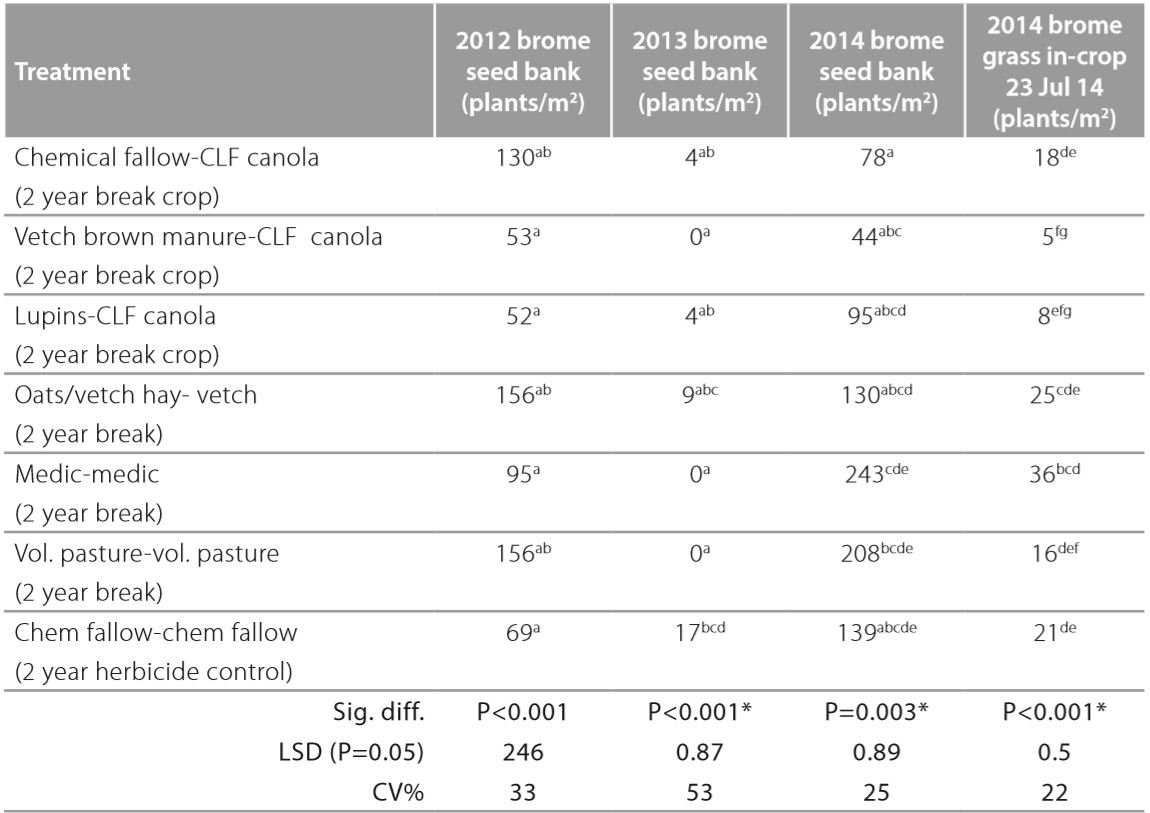
*Significant difference determined from log transformed data.
2013 and 2014 wheat yields
In 2013 and 2014 wheat was grown in all sequences and averaged 2.4 and 2.3t/ha respectively. In 2013, the highest wheat yield (3.5t/ha) was on the chemical fallow-chemical fallow treatment implemented in the years prior (Figure 1).
The lowest yield of 1.0t/ha was in the wheat-wheat sequence with no herbicide control, which was significantly lower than any other treatment. Other sequences with low yields were the one year break sequences of chemical fallow-wheat, field peas-wheat and the two year herbicide sequence of wheat + Atlantis-CLF barley (1.7t/ha – 2.1t/ha).
All two year break crop sequences, apart from CLF wheat-chickpeas, chemical fallow-CLF canola and CLF wheat-CLF wheat, yielded at least 1.2t/ha more than the lowest yielding treatments.
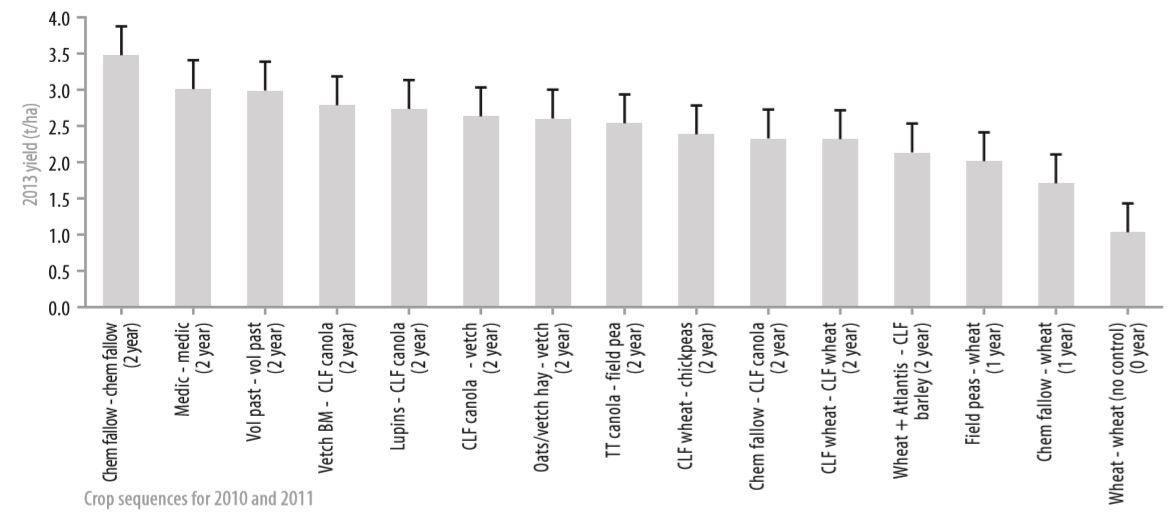
Figure 1. Yield for 2013 (t/ha), P<0.001, LSD 0.4 t/ha, CV 10%.
In 2014, the top ten sequences were similar in yield (2.7 to 2.3t/ha) (Figure 2). These sequences yielded approximately 0.5t/ha more than those with the lowest yields including the one year break sequences of chemical fallow-wheat, field peas-wheat and wheat + Atlantis-CLF barley, plus CLF wheat-chickpeas (1.8t/ha – 2.1t/ha). Interestingly, the CLF wheat-CLF wheat sequence yielded 0.6t/ha more than these treatments, which all had one or two wheat phases grown in 2011 and/or 2012. The CLF wheat-CLF wheat sequence, which had low brome grass numbers in-crop of 4 plants/m2, yielded 0.2t/ha more than the CLF canola-vetch sequence which had 29 plants/m2 brome grass plants; and 0.6t/ha more than field peas-wheat which had 94 plants/m2 brome grass plants. It was quite likely that these differences in brome grass pressure resulted in decreased yield for the sequences with higher brome grass numbers.
Wheat-wheat (no control) treatments were terminated mid-year because of the excessive brome grass population that had developed and the potential weed issue posed for the grower.
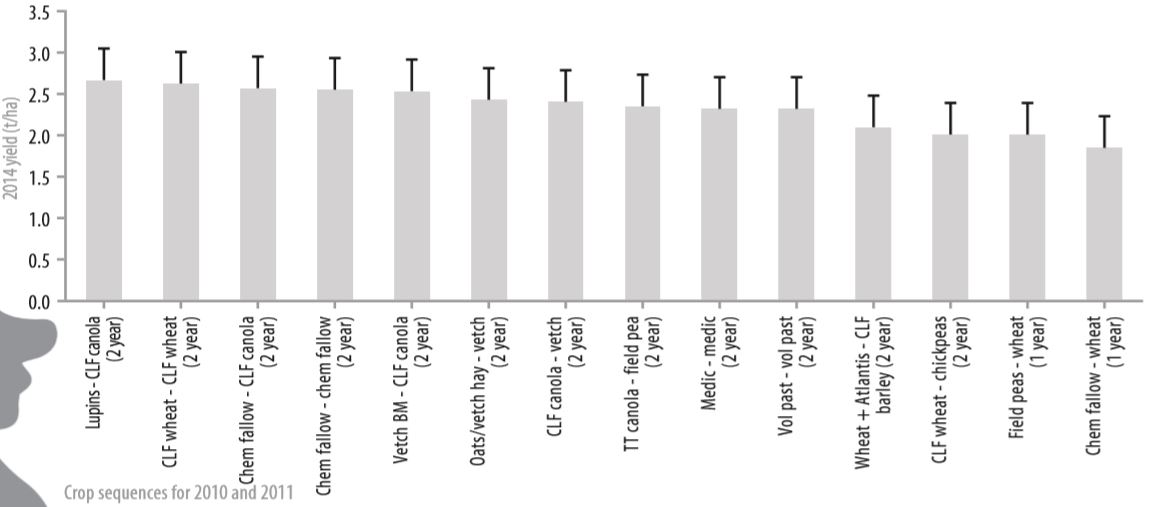
Figure 2. Yield for 2014 yield (t/ha), P<0.014, LSD =0.4 t/ha, CV 11%.
Gross margins compared with 2014 in-crop brome grass
The highest 2011-2014 cumulative gross margins (range: $1626 to $1344) were generated by the following 2010 and 2011 sequences:
- CLF canola-vetch, CLF wheat-chickpeas, TT canola-field pea and oats/vetch hay-vetch
- one year brome grass control sequence, field peas-wheat
- continuous wheat with Group B herbicide control of CLF wheat-CLF wheat.
All these treatments, apart from CLF wheat-CLF wheat, also had high gross margins in 2011 and/or 2012 (Figure 3).
The lowest cumulative gross margins, which occurred when income was not generated in either 2011 and 2012, were from the chemical fallow-chemical fallow, chemical fallow-wheat and vetch brown manure-CLF canola sequences, as well as the two pasture treatments where income was dependent upon livestock grazing on volunteer pasture-volunteer pasture and medic-medic (range: $1040-$934).
When cumulative gross margin and 2014 in-crop brome grass weeds were considered, the best performing sequence, with high profitability and low brome grass (4 plants/m2), was CLF wheat-CLF wheat at $1502/ha. Other sequences with low brome grass numbers were vetch brown manure-CLF canola ($997/ha; 5 plants/m2) and lupins-CLF canola ($1181/ha; 8 plants/m2), but their profitability was less.
The CLF canola-vetch ($1626; 29 plants/m2), CLF wheat-chickpeas ($1497; 24 plants/m2), oats/vetch hay-vetch ($1408; 25 plants/m2) and TT canola-field peas ($1344; 20 plants/m2) sequences had profitable gross margins but brome grass numbers were higher at 20 to 29 plants/m2.
The one year break of field peas-wheat was very profitable, but brome grass numbers were unacceptably high ($1564/ha; 94 plants/m2).
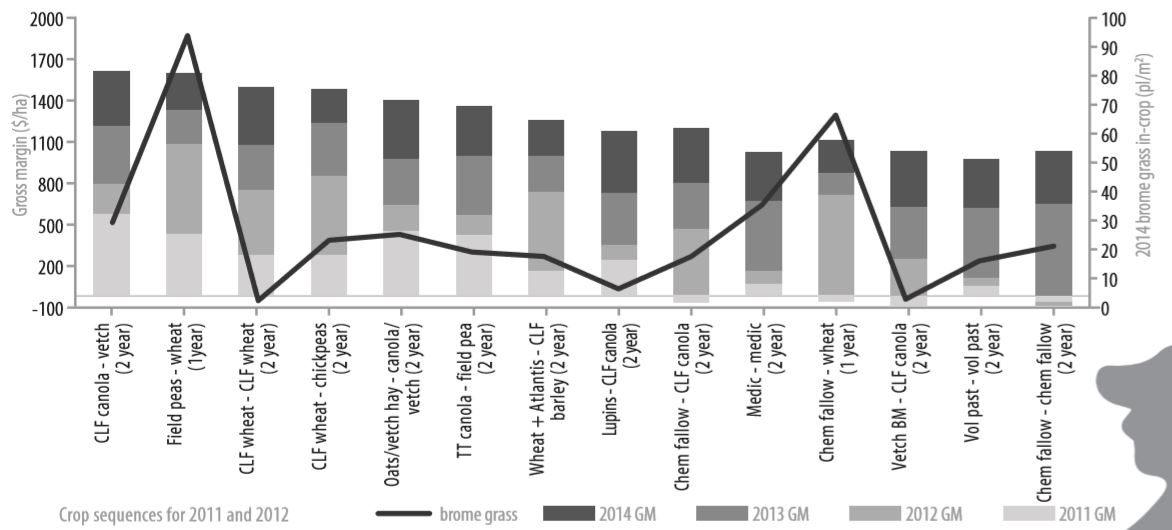
Figure 6. 2011-2014 annual gross margins ($/ha), cumulative gross margin ($/ha) and 2014 brome grass numbers in-crop (plants/m2). 2011 gross margin ($/ha) P<0.001, LSD =126 $/ha; CV 37%; 2012 gross margin ($/ha) P<0.001, LSD =179 $/ha, CV 33%; 2013 gross margin ($/ha) P<0.001, LSD =106$/ha, CV 17%; 2014 gross margin ($/ha) P=NS, CV22%; Cumulative gross margin ($/ha) P<0.001, LSD =303 $/ha, CV 14% and brome grass in-crop (plants/m2) log10: P<0.001, LSD =0.5plants/m2, CV 22%).
COMMERCIAL PRACTICE
In years with high levels of pre-sowing soil water, continuous crop sequences that include high value crops such as canola, chickpeas and field peas can return profitable gross margins.
Over the four years of this trial, growing two year break crop strategies followed by two years of wheat was profitable with CLF canola-vetch, CLF wheat-chickpeas, oats/vetch hay-vetch and TT canola-field peas break rotations returning profitable gross margins of $1692 to $1344/ha. However, it should be noted that in these treatments, by the fourth year of the trial brome grass numbers increased to 20-29plants/m2. These brome grass numbers reduced yields by 0.2t/ha or 8% (with 29 plants/m2) and were substantially higher than the CLF wheat-CLF wheat sequence in which brome grass numbers of 4 plants/m2 were evident. It is likely, however, that these weed numbers, with no further control, would escalate in the following year.
The three consecutive years of wheat following a one year break of field peas was also very profitable ($1564/ha), but brome grass weed control was poor, with 94 plants/m2 measured in 2014. This level of brome grass saw a yield reduction of 0.6t/ha (32%), compared with where brome grass numbers were lowest. This supports a previous study by Gill et al. 1987, where a population of 100 plants/m2 of brome grass led to an average yield loss of 30% in wheat crops, due to its high level of competitiveness for water, nutrients and space.
The CLF wheat-CLF wheat sequence followed by two consecutive years of wheat returned one of the highest gross margins and best weed control options. However, while Group B Clearfield herbicides deliver effective brome grass control, their continuous use is likely to speed up the onset of herbicide resistance.
Where brome grass seed bank populations are high, break crop sequences of a minimum of two years are necessary to decrease weed numbers sufficiently. However, to maintain low brome grass numbers, continued management is required, and break crops giving better management options may need to feature more regularly in the cropping program; potentially for periods longer than two years.
To decrease reliance on herbicides, alternative cultural weed control methods, such as windrow burning, chaff carts and weed seed destroyers at harvest should be considered for reducing brome grass weeds.
ON-FARM PROFITABILITY
Alternative crop types to wheat should be considered where soil water is abundant and weed burden is an issue. In this study, two year breaks followed by two consecutive years of wheat returned an average of $423/ha to $336/ha per year for four years.
REFERENCES
Gill, G.S., Poole, M.L. & Holmes, J.E. (1987) Competition between wheat and brome grass in Western Australia. Australian Journal of Experimental Agriculture vol. 27, pp. 291-294.
ACKNOWLEDGEMENTS
This project (DAS00119) was funded by GRDC through the Low Rainfall Collaboration Group.
