BACKGROUND
Crop phenology is the study of the life cycle of crops and how it is influenced by seasonal variations in climate. The maturity of cereal crops is controlled by their response to average daily temperatures (thermal time), but this is moderated by day length (photoperiod) and cold requirement (vernalisation). Different wheat and barley varieties have different genetic sensitivity to photoperiod and vernalisation.
All cereal varieties accumulate heat (thermal time) in order to grow. For example, wheat varieties grown in our region develop a new leaf every 100 degree days. A degree day is achieved in that, when the average daily temperature for a number of days adds up to 100 degrees, the wheat plant will have formed a new leaf.
Photoperiod is the plant’s response to day length (hours of daylight). Lengthening days induce the plant to speed up the rate of change from vegetative to reproductive development (from growing leaves to the development of flowering organs).
Vernalisation occurs when a plant is subjected to low temperatures for a specific time. When the vernalisation requirement has been reached, the plant speeds up the rate of change from vegetative to reproductive development.
True ‘winter’ types require a long vernalisation period before they develop into their reproductive phase (for example Rosella wheat). Most ‘spring’ types of wheat have little or no requirement for a cold period and will continue to grow and develop throughout the season (for example Catalina wheat).
There is increasing evidence that the climate is changing in response to human-influenced emissions of greenhouse gasses. These emissions are almost certainly increasing the atmospheric CO2 concentrations. Climate change probably have a range of impacts on global mean temperatures. The increase in CO2 and temperature are likely to have a significant impact on the development of our crops.
Cereal growth stages are important to cereal growers because they provide a common reference for describing the crop’s development, so that we can implement agronomic decisions based on a common understanding of which stage the crop has reached. Management by growth stage is critical to optimise returns from inputs such as nitrogen, plant growth regulators, fungicides and water.
It has become apparent that a number of wheat and barley varieties do not follow their published maturity classifications. This being the case, if we are to maximise our crop’s potential, it is important that growers and consultants have a sound understanding of how crops develop and how we can influence that development with our management practices and not just rely on the published classifications. .
Funded through the Managing Climate Variability Program, the phenology trial is one of three conducted across Australia. Other trials were established at Gatton QLD and Tarlee SA.
TAKE HOME MESSAGES
- wheat and barley varieties do not necessarily behave according to their varietal classification
- a sound understanding of the phenology of varieties can help to ensure that varieties are sown in their appropriate sowing window maximising crop potential
AIM
To take detailed phenology measurements of eight wheat and barley varieties
METHOD
Location: Jil Jil
Replicates: 3
Sowing date: time of sowing (TOS) 1* – 13 May 2011, TOS 2 – 28 June 2011
Seeding density: 150plants/m2
Crop type/s: 8 wheat and 8 barley varieties
Inputs/Fertiliser:
sowing – 55kg MAP/ha + high intake gold 800ml/100kg
30 June 2011 – Urea 43kg/ha
Seeding equipment: knife point, press wheel, 30cm row spacing
N.B. * TOS= Time of Sowing, during the week of 12 July TOS was heavily grazed by rogue sheep.
The trial was established with eight wheat and eight barley varieties, two sowing times and three replicates, forming a total of 96 plots. On a weekly basis, each plot’s growth stage was assessed using the Zadock Decimal Code. Each development phase was assessed using the following procedures:
Seedling growth (GS11-16): assessed using the Haun Scale method. The emerging leaf is scored to one decimal point relative to the length of the previous leaf on the main stem (e.g. when the second leaf is half the length of the first leaf, the plant has reached GS11.5). When the emerging leaf has reached the length of the previous leaf, it is considered to be fully emerged.
Tillering (GS20-29): subsequent to the seedling growth stage, shoots appearing from the base of the plant (tillers) are counted and recorded. Tillering and the vegetative phase are considered complete upon the development of the first node. In this trial, three plants were randomly selected from each plot, dissected and assessed for nodes.
Stem elongation (GS30-39): GS30 (leaf sheath erection) is reached when the distance from the base of the stem to the shoot apex is 1cm or more, but the length of the first inter-node is less than 1cm. Upon the appearance of the first node, plots are thereafter assessed for nodes by feel (i.e. non-destructively) on the main stem of three plants in each plot (for more information, refer to Cereal Growth Stages – The Link to Crop Management. The emergence of the flag leaf was scored on the main stems of several plants in each plot (i.e. GS37 is reached when the flag leaf is visible; GS39 is reached when the flag leaf ligules are visible).
Booting (GS40-49): early (GS43), mid (GS45) and late (GS47) booting were scored on all stems in a plot (i.e. not only the main stems). The end of booting (GS49) was reached when the awns were visible from the top of the boot on at least 50% of the stems.
Head emergence (GS50-59): head emergence was scored on all stems in a plot (ie. not only main stems) and assessed on a percentage basis. For example, GS55 was achieved when the heads were fully emerged on half of the stems. GS59 was achieved when the heads were fully emerged on 90% of the stems.
Flowering (GS61-69): flowering was assessed in an equivalent fashion to booting and head emergence, and was scored on all stems. The percentage of stems with visible anthers determined the growth stage. For example, GS61 was achieved when any anthers were visible on any heads (<10%). GS65 was achieved when anthers were visible on 50% of heads.
Grain filling (GS70-89): grain filling was assessed on seeds taken from spikelets from the middle of several heads in each plot. To assess milk development, seeds were squashed between the thumb and forefinger with either clear liquid (GS73), early milk (GS75) and half solid (GS79) produced. Dough development was assessed by using a thumbnail impression (mostly solid (GS81), kernel soft (GS83), no impression (GS85) and impression held (GS87)).
Ripening (GS90-92): physiological maturity (GS91) and harvest ripe (GS92) were scored on seeds taken from spikelets from the middle of several heads in each plot. Physiological maturity was reached when no indentation could be formed when pressing a fingernail into the grain. Harvest ripe was reached when the grain was hard when bitten.
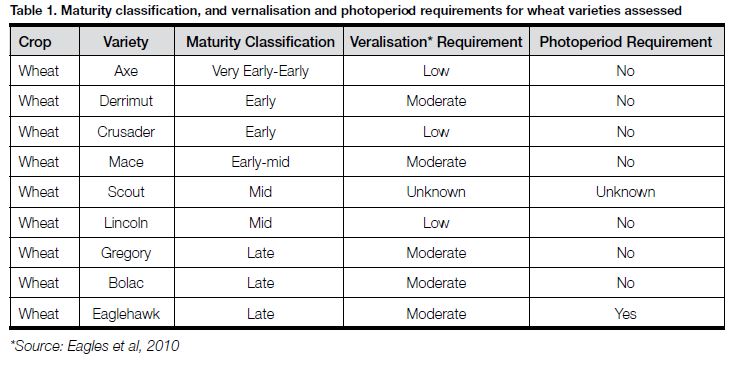
The photoperiod and the vernalisation requirement for all the barley varieties are unknown.
To track the temperature over the growing period a Tiny Tag data logger was stationed at the site with readings taken every 15 minutes. Rainfall was regularly recorded using a manual rain gauge.
RESULTS
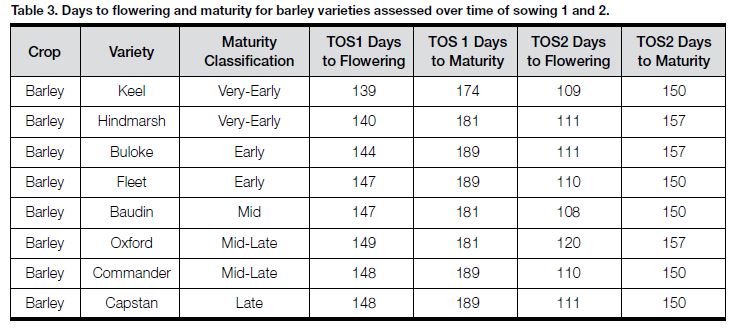
The number of days to flowering and maturity was about thirty days longer for TOS1 compared with TOS2 for both the wheat and barley cultivars. This confirms previous observations: ‘Although the rate of leaf emergence is constant for given cultivars and sowing time, it varies systematically with the sowing date. The reason for this is unknown’ (Anderson and Garlinge, 2000).
WHEAT
With the exception of Axe (classified as Very Early-Early) and Bolac and Eaglehawk (Late), the phenology of the wheat varieties was very similar. The remaining varieties reached flowering and maturity within a few days of each other for TOS1. As such, it is apparent that Early varieties (Derrimut, Crusader and Mace) and the Late variety Gregory did not follow their published maturity classifications.
The TOS 2 wheat varieties were closer to reflecting their maturity classification in days to flowering. The early varieties reached flowering a few days earlier than the mid varieties and the late varieties were a further few days behind. However, despite the early differences at flowering, maturity was reached consistently across all varieties, with the exception of Mace and Derrimut.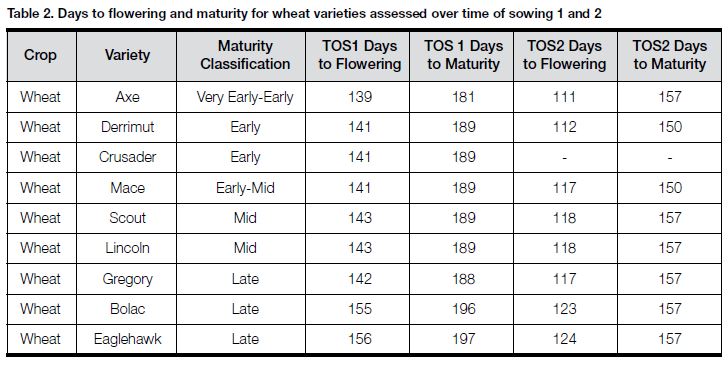
BARLEY
With the exception of Keel and Hindmarsh (classified as Very-Early), the phenology of the barley varieties was very similar. The remaining varieties reached flowering and maturity within a few days of each other for TOS1. It is apparent that the early varieties (Buloke and Fleet) and the later varieties (Oxford, Commander and Capstan) did not follow their published maturity classifications.
The TOS 2 barley varieties reached flowering within a few days of each other with the exception of Oxford (Mid-Late). Maturity was reached consistently across all varieties. Again we have a situation in which a number of the varieties have not been following their maturity classifications.
TEMPERATURE
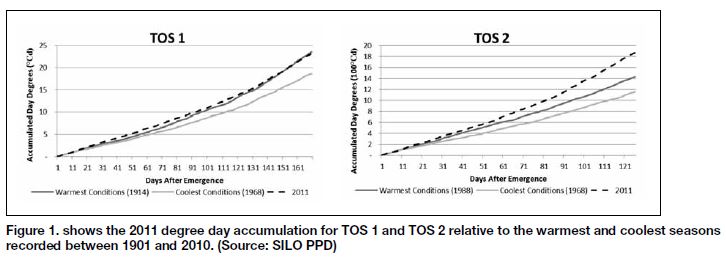
‘Leaf emergence is the key to understanding and predicting the development of the cereal plant because leaf emergence is closely coordinated with growth and development changes that are often difficult to see within the plant … The rate at which leaves appear depends on the daily temperature’ (Anderson and Garlinge, 2000). Leaf appearance is measured in thermal time: accumulated day degrees (°Cd). A day degree is the average daily temperature for each day, then totalled for all the days involved. For example, in our region a wheat plant will develop a new leaf every 100 degree days. When the average daily temperature for a number of days adds up to 100 degrees the wheat plant will have formed a new leaf.
Figure 1 shows the 2011 day degree accumulation for TOS 1 and TOS 2 relative to the warmest and coolest seasons recorded between 1901 and 2010. The charts allow for an impression of the temperature in 2011 compared with the past. The accumulated day degrees for TOS 1 were equivalent to the warmest season in recorded history (1914). The accumulated day degrees for TOS 2 exceeded the warmest season in recorded history (1988).
INTERPRETATION
It is clear from the results that many wheat and barley varieties do not necessarily behave according to their published varietal classification. Each variety is affected differently by sowing date, and environmental conditions. The reduction in the time taken for the varieties to reach flowering in TOS 2 compared with TOS 1 is indicative of the increased rate in thermal accumulation in TOS 2. The TOS 2 varieties progress faster because of the warmer conditions in the latter half of the season compared with the initial part. ‘Between about 0°C and 30°C most plant processes double in rate as the temperature increases every 10°C’ (Anderson and Garlinge, 2000).
A possible cause of the lack of differentiation between varieties in this trial was that the conditions in 2011 were warmer than normal. The increased rate of growth for all varieties meant that it was more difficult to pick up differences in measurements. The weekly assessments conducted as part this trial may not have been sufficiently frequent to capture differences in varieties that behave similarly but not identically. That said, Axe (Very Early-Early) and Bolac and Eaglehawk (Late) from TOS 1 did behave as expected. This is likely to be the result of the low vernalisation requirement and no photoperiod requirement for Axe and the moderate vernalisation requirement and the photoperiod requirement for Bolac and Eaglehawk.
There is a lack of information about the photoperiod and vernalisation genes of barley. As a result, it is difficult to draw any solid conclusions about the phenology of barley from this trial. However, it seems that our impression that barley varieties have vastly different phenology may not be warranted.
COMMERCIAL PRACTICE
Current agronomic advice is to sow a number of wheat and barley varieties with the aim of reducing the risk associated with negative factors such as frost, heat shock, disease, and drought. This can be a very good practice, but if you want to reduce the risk of frost and heat shock it is important to take into account when the crop is likely to flower. Further to this, management by growth stage is critical to optimise returns from inputs such as nitrogen, plant growth regulators, fungicides and water.
A sound understanding of the phenology of varieties will help to ensure that varieties are sown in the appropriate sowing window to maximise crop potential. Growers should endeavour to learn how to assess their crop growth stage, a practice essential for effective communication between grower and advisor. It provides a common reference for describing the crop’s development, so that we can implement agronomic decisions based on a common understanding of which stage the crop has reached.
ACKNOWLEDGEMENTS
This trial was funded by GRDC (Project MCV00030) through the Managing Climate Variability Program.
REFERENCES
H.A. Eagles, Karen Cane, Haydn Kuchel, G.J. Hollamby, Neil Vallance, R.F. Eastwood, N.N. Gororo, and
P.J. Martin (2010) ‘Photoperiod and vernalization gene effects in southern Australian wheat’, Crop & Pasture Science 61 pg 721-730
W.K. Anderson and J.R. Garlinge (2000) The Wheat Book Principles and Practice, (Agriculture Western Australia)
