Take Home Messages
- Many growers struggle with making informed nitrogen decisions.
- Two decision support systems, Yield Prophet® and N banks, are consistently profitable, however the success of both approaches can vary year to year.
- In a multi-year nitrogen management trial (2018–2024), the YP50% strategy provided a high gross margin whilst mitigating the loss of soil organic N through a lower, but positive, partial N balance.
Aim
To assess various nitrogen management systems aimed at profitably reducing yield gaps caused by nitrogen deficiency, while mitigating the decline in soil organic matter.
Background
Two key factors affect wheat yield potential in Australia: rainfall and nitrogen (N). Outside of received rainfall (Hochman et al., 2017), which can’t be controlled, wheat yields only reach half of their potential, mainly due to receiving insufficient N (Hochman and Horan, 2018). Grain yields for other non-legume crops (barley, canola and oats) are likely to demonstrate similar limitations. Under-fertilisation can also leave the soil with a negative N balance (exporting more N in grain than is returned with legumes and fertiliser (Norton and Elaina vanderMark, 2016). This can lead to the mining of soil organic N and associated soil organic matter causing N mineralisation decline, which is estimated to halve every 20 to 30 years in continuous cropping systems (Dalal and Mayer, 1986, Clarke and Russell, 1976, and Heenan et al., 2004). Remedying insufficient N supply to grain crops is possible and would have a substantial impact on the profitability of Australian farming enterprises; some data shows reducing N deficiency in wheat would increase Australian wheat yields by 40 per cent (Hochman and Horan, 2018, Hunt et al., 2021).
Legumes are commonly incorporated into cropping rotations either as pastures, brown manures, or for grain. However, grain legumes do not leave behind enough N to support the yield of subsequent crops, and not every cropping rotation will incorporate a legume pasture or brown manure. Yields of subsequent crops are therefore reliant on the input of additional N through fertiliser, yet growers can be hesitant to apply higher levels of N fertiliser due to concerns relating to risks to the crop (‘haying off’), environment loss (leaching, volatilisation, denitrification), and economic factors (such as the cost of urea) (Hunt et al., 2021). Growers in southern Australia tend to under-fertilise because of these risks – and possibly the emphasis placed on them – as well as uncertainty of rainfall and yield which determines overall N demand.
Nitrogen management decisions are a key area of concern for Australian growers. More than 50 per cent of growers surveyed as part of the GRDC RiskWi$e project reported that making decisions relating to N management was challenging, with a subset of growers describing the decisions as ‘very difficult’ (Figure 1); this is where Decision Support Systems (DSS) can aid growers in identifying strategies for looming N decisions.
Growers have access to two key DSS that can help with N decisions: Yield Prophet® and N banks. Yield Prophet® helps match N input to the potential yield for a given season. This predictive management tool relies on APSIM modelling, and as such, the quality of output is reflective of the quality of input; the trade-off being that the cost (or time required) of collecting input data may be too high for some growers. Yield Prophet® might best be considered a DSS for growers who want to take a more ‘active’ approach to N management. On the other hand, some growers may prefer to employ a lower time and money-cost method by using N banks, a simpler, more ‘passive’ strategy that capitalises on year-to-year soil N carry-over to support crop growth.
As part of the GRDC RiskWi$e project BCG is testing N banks and Yield Profit® in a network of N management trials to establish the risk and reward profiles of both systems. A multi-year trial was established in 2018 at Curyo, Victoria, to compare different N management strategies, including Yield Prophet® and N banks. Findings for several of the N management strategies from 2018 to 2024 are summarised here.
Paddock Details
Location: Curyo
Soil type: Sandy loam topsoil with clay content and calcium carbonate increasing with depth
Trial Details
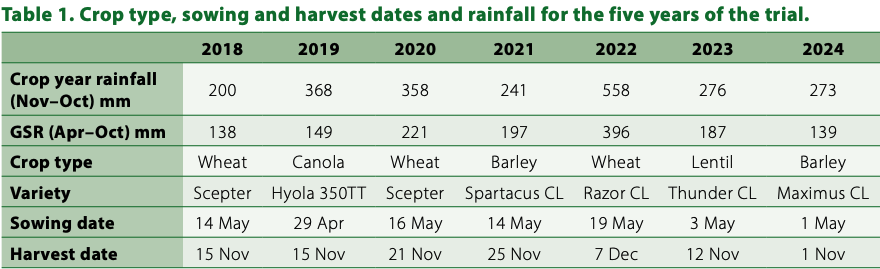
Treatments: Refer to Table 1
Seeding equipment: Knife points, press wheels, 30cm row spacing
Replicates: Four
Trial Inputs
N fertiliser:
Starter fertiliser:
- 2018: Urea at 35kg/ha at sowing (host farmer management)
- 2019: Granulock Z at 60kg/ha at sowing
- 2020: Granulock Z at 60kg/ha at sowing
- 2021: Granulock Z at 60kg/ha + triple superphosphate at 35kg/ha at sowing
- 2022: Granulock Z at60kg/ha + triple superphosphate at 35kg/ha at sowing
- 2023: Granulock Z at 60kg/ha + triple superphosphate at 35kg/ha at sowing
- 2024: Granulock Z at 60kg/ha + triple superphosphate at 35kg/ha at sowing
The experiment was kept free of weeds and disease as per current best practice management.
Trial Inputs
N management strategy set up
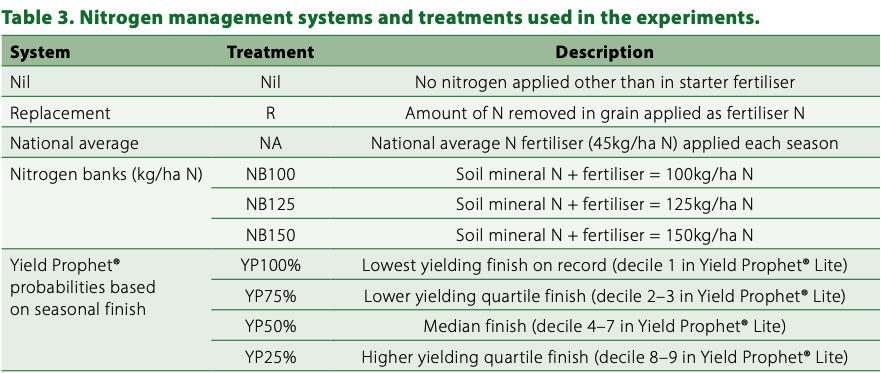
A multi-year experiment using a randomised complete block design was established in 2018 to evaluate the performance of different N management systems. Four different systems were tested:
- Matching N fertiliser to seasonal yield potential (Yield Prophet® and Yield Prophet® Lite, YP)
- Maintaining a base level of fertility using N fertiliser (N banks)
- Replacing the amount of N removed in grain each year with fertiliser in the next season (replacement)
- Applying national average N fertiliser rate (45kg/ha) each season (national average, NA)
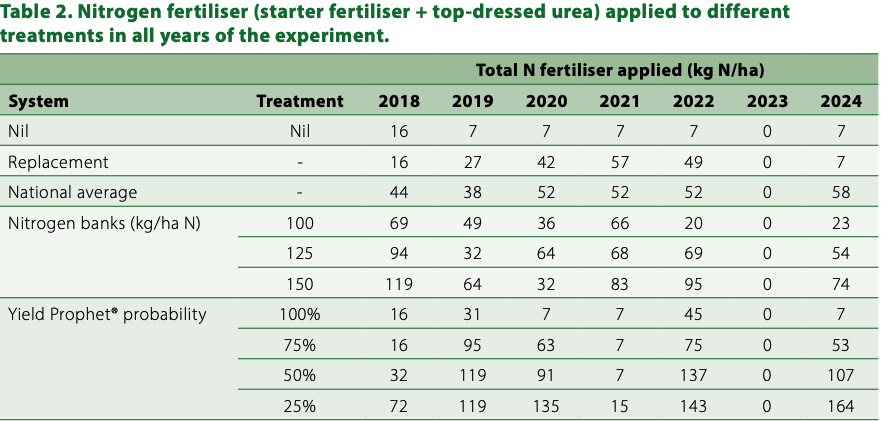
All systems were compared to a nil control which received only starter fertiliser (7kg N/ha per year of MAP). Within the Yield Prophet® and N bank systems there were different treatments targeting different yield potentials (Table 3). In the Yield Prophet® treatment before 2021, water limited potential yield was determined at different levels of probability; the amount of N required to achieve these yields was applied, assuming a requirement of 40kg/ha N per t/ha of wheat yield and 80kg/ha N per t/ha of canola yield. From 2021 onward, Yield Prophet® Lite was used in a similar way. There were different target levels of N fertility (N bank targets) for the N bank treatments. N fertiliser rates in these treatments were calculated as the N bank target value minus soil mineral N (kg/ha) measured before sowing. Gross margins were calculated based on the 2024 SAGIT Gross Margin Guide (SAGIT, 2024). Average N fertiliser cost was based on calculations from historical SAGIT Gross Margin Guides over the seven-year period (2018–2024).
Future of the Trial
2018–2022 results
Please see BCG Season Research Results from 2018–2022 growing seasons for previous results of the experiments. No article was published in 2023 as this trial was sown to lentils.
2024 results
Soil mineral N levels ranged from 63kg/ha to 71kg/ha, and no significant differences were detected between treatments (Table 4). The highest grain yield was achieved by YP25% (6.8t/ha), which was significantly higher than all other treatments, except YP50%, YP75%, and National average treatments (6.6, 6.07, and 6.1t/ha, respectively) (p < 0.001, LSD = 0.8). YP25%, also delivered the highest protein percentage (11.4%), significantly higher than all other treatments (p < 0.001, LSD = 0.5), and came in as second highest gross margin ($1247/ha), behind YP50% ($1284/ha). By comparison, the Nil and Replacement treatments had the lowest yields (4.48–4.71t/ha) and protein (7.6–8.1%), reflecting limited nitrogen availability. Performance of all three N bank treatments sat between the highest and lowest treatments across all yield, protein, and gross margins.
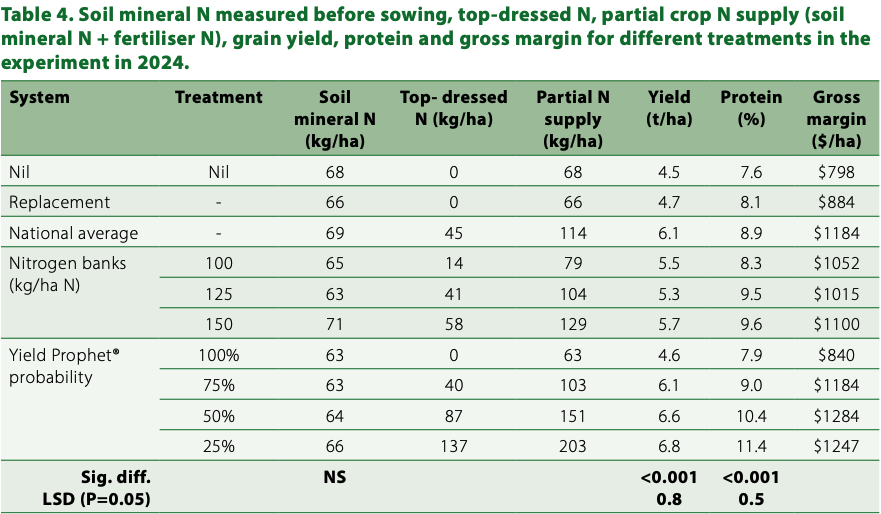
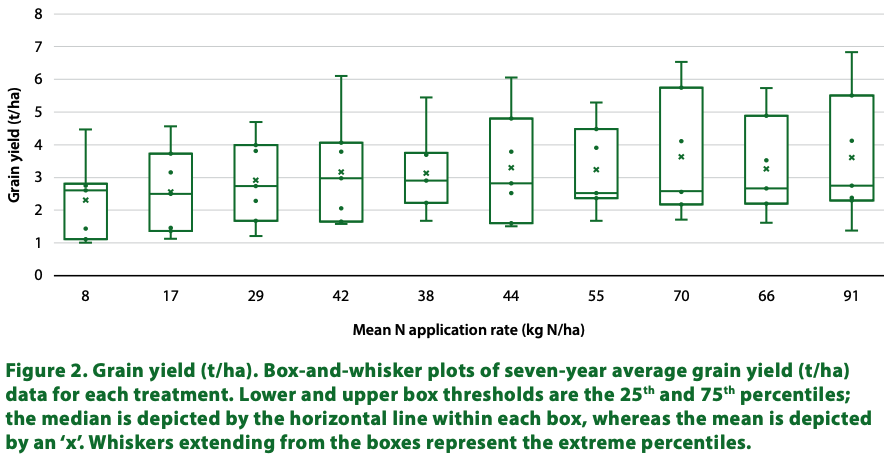
Seven-year averages Grain yield data over the seven trial years for each N management treatment are shown in Figure 2. On average across the seven years, the YP25% and YP50% treatments were the most promising strategies in closing the yield gap (3.62t/ha and 3.64t/ha, respectively), and both treatments were significantly higher than all other treatments (p < 0.001, LSD = 0.29). YP25% showed a relatively high seven-year cumulative partial N balance of 114 kg/ha compared to YP50% (17kg/ha), indicating a higher chance of N loss under this treatment in this environment (Figure 5). Given the relatively minor difference in grain yield between YP25% and YP50%, and the substantial difference in partial N balance, YP50% is the optimal N strategy for this environment.
No significant differences were observed in mean grain yield between the three N bank treatments NB100, NB125, and NB150 (3.1t/ha, 3.2t/ha, 3.3t/ha, respectively), over the seven-year average. However, considering the partial N balance for all three treatments, NB125 showed an almost neutral balance (-2kg/ha) relative to NB100 and NB150 (-96kg/ha and 49kg/ha, respectively) over the seven years. This suggests the NB125 strategy is the best option of the N bank treatments for this environment.
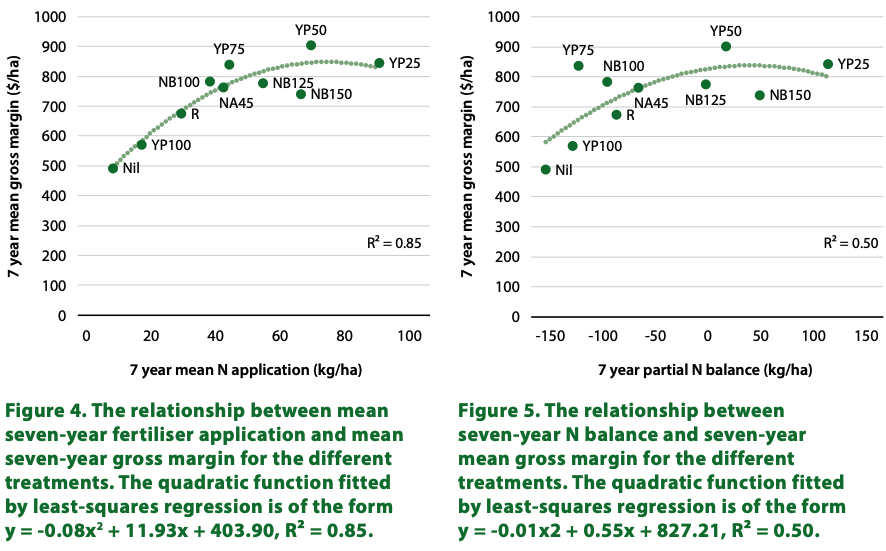
The highest average gross margin across the seven years was achieved by YP50% ($903), closely followed by YP25% ($844), YP75% ($838), NB100 ($783), and NB125 ($776, p < 0.001, LSD $133) which were all statistically assessed as not different from each other (Figure 3). This is illustrated in Figure 4, where the relationship between mean N application and gross margin can be seen to be flattening out.
YP50%, YP75%, NB100, and NB125 all avoided a negative gross margin over the seven year period and consequently had lower down side risk in the longer term, contrary to YP25% which did record a negative gross margin (Figure 3). Lower gross margins were achieved with the National Average ($763), NB150 ($739), Replacement ($674), YP100% ($571), and Nil strategies (492).
Taking into consideration grain yield, cumulative partial N balance average across seven years, and the downside risk, YP50% has been shown to be the better all round N strategy in this environment. For decision-makers seeking a straightforward strategy with consistent results, NB125 stands out as the most reliable simplified nitrogen management option.
Commercial Practice and On-Farm Profitability
In 2024, the YP25% treatment demonstrated outstanding performance, achieving the highest grain yield and protein percentage, and the second highest gross margin. Over the seven-year average, YP50% also dominated the highest yields and economic returns, whilst minimising seven-year cumulative partial N balance, indicating it is the optimal treatment for this environment. Alternatively, single-year and seven-year average results showed N bank treatments offered a balanced intermediate performance across all metrics, particularly NB125, which maintained a neutral cumulative partial N balance across the seven years. The advantage of this strategy is the simplified decision-making process which is likely to appeal to some grain growers. The Nil and Replacement treatments highlighted the limitations of restricted N availability, producing the lowest yields and protein levels in both 2024 and across the seven-year average.
Growers are encouraged to conduct soil testing and use environmentally appropriate N Decision Support Systems, such as Yield Prophet® or N Banks, to optimise profitability. These findings demonstrate that both approaches are effective decision-making tools for maximising returns in both the short and long-term. The choice between these strategies is likely influenced by growers’ preference for simplicity or complexity in N management.
References
Brown B., Azeem M., and Llewellyn R., 2024, ‘An overview of Australian grain grower risky decision processes’.
Clarke AL., and Russell JS., 1977, ‘Crop Sequential Practices’. In: J.S. Russell & E.L. Greacen (Eds): Soil factors in crop production in a semi-arid environment. University of Queensland Press, St Lucia.
Dalal RC., and Mayer RJ., 1986, Soil Research, ‘Long term trends in fertility of soils under continuous cultivation and cereal cropping in southern Queensland’. II. Total organic carbon and its rate of loss from the soil profile. 24, pp 281–292. <https://doi.org/10.1071/SR9860281>
Heenan DP., Chan KY., and Knight PG., 2004, Soil and Tillage Research, ‘Long-term impact of rotation, tillage and stubble management on the loss of soil organic carbon and nitrogen from a Chromic Luvisol’, Volume 76, Issue 1, pp 59–68. <https://doi.org/10.1016/j.still.2003.08.005>
Hochman Z., and Horan H.,(2018. Field Crops Research, ‘Causes of wheat yield gaps and opportunities to advance the water-limited yield frontier in Australia’. Field Crops Research 228, pp 20–30. Hunt JR., Kirkegaard JA., Maddern K., and Murray J., 2021,
GRDC ‘Strategies for long term management of N across farming systems’. Accessed 15 January 2025. <https://grdc.com.au/resources-andpublications/grdc-update-papers/tab-content/grdc-update-papers/2021/02/strategies-for-long-termmanagement-of-n-across-farming-systems>
Norton R., and vanderMark E., (2016). ‘Nitrogen performance indicators on southern Australian grain farms’. Proceedings of the 2016 International Nitrogen Initiative Conference, Solutions to improve nitrogen use efficiency for the world, 4–8 December 2016, Melbourne, Australia.
SAGIT,2024, 2024 Gross Margin Guide. Accessed 15 January 2025. <https://sagit.com.au/wp-content/uploads/2024/02/24210.03.01-Gross-Margins-Guide-2024_WEB.pdf>
Acknowledgements
This research has been funded by the GRDC since 2022, initially through the National Grower Network project, N banking strategies to manage variable and unpredictable nitrogen demand in the MRZ of the Southern Region (PROC-9176566), and currently as part of the National RiskWi$e project (PROC‑9176569). From 2018 to 2019, the research was funded by La Trobe University through the Securing Food, Water and the Environment Research Focus Area. Funding was subsequently provided by the Mallee Catchment Management Authority from 2019 to 2022, through the Australian Government’s National Landcare Program and GRDC, through its National Grower Network.
Thank you to Professor James Hunt, the University of Melbourne, for providing a technical review of this article.
BCG sincerely thanks Paul Barclay for generously hosting the trial site at Curyo and for support throughout the project.
