Take home messages
- Growers should check the grain weight, germination of retained seed and calibrate accordingly to achieve consistent plant establishment from season to season.
- Correct seeder calibration amounted to a 0.3t/ha yield or $60/ha gain.
- If phosphorus (P) soil reserves are low, consider increasing P fertiliser rates to achieve optimal yields.
Background
Does seed size matter?
Seed size of grain varies from season to season, from paddock to paddock, between varieties and with different management practices. This variation can be managed by routinely calibrating the air seeder each season to adjust seeding rates and achieve a standard plant population.
A below average rainfall year in 2015 produced smaller grain whilst an above average (Decile 10) season in 2016 produced larger grains.
Research has shown the optimal plant population of cereals in the Mallee is 130 plants/m2 and 150 plants/m2 in the Wimmera, and approximately 150 – 200 plants/m2 in the high rainfall zone.
Calibrating the seeder potentially avoids wasting money on seed not needed, and creates an optimal crop structure for yield and quality from the start of the season.
After good production years, are growers applying enough phosphorus to achieve a high yield potential?
Phosphorus (P) is one of the major nutrients required for cereal cropping. It is essential for cell division, the development of the growing tip of a plant, photosynthesis, respiration and energy storage. For this reason, it is vital for seedlings and young plants to have access to it.
Research in the Wimmera and Mallee suggests responses to P fertiliser tend to be strongest during early growth and tillering but as the plant transitions into the reproductive phase after GS30, the stem starts to elongate and there is generally a reduced response to P.
Rates of 5 to 10kg/ha of P are commonly applied in the Wimmera and Mallee however after 2016, where barley yields averaged 6t/ha, removal rates of P from grain and stubble could have seen more P removed from the cropping system than in previous years.
Aim
To assess the impact of small and large seed size sown to target plant density and kg/ha with different P rates on barley yield and quality.
Paddock details
| Location: | Curyo |
| Crop year rainfall: | 297mm |
| GSR (Apr-Oct): | 215mm |
| Soil type: | Sandy loam |
| Paddock history: | 2016 PBA Bolt lentils |
| Colwell P: | 18mg/kg |
| P Buffer Index: | 85 |
| DGT P: | 8ug/L |
Trial details
| Crop type/s: | Compass barley |
| Treatments: | See Table 1 |
| Target plant density: | 130 plants/m2 |
| Seeding equipment: | Knife points, press wheels, 30cm row spacing |
| Sowing date: | 12 May 2017 |
| Harvest date: | 13 November 2017 |
| Trial average yield: | 4.7 t/ha |
Trial inputs
| Fertiliser: | June 1 | Urea @ 90kg/ha |
| August 6 | Urea @ 60kg/ha | |
| Herbicide: | June 15 | Velocity® @ 670mL/ha + MPCA LVE® @ 400mL/ha+ Hasten 0.5% |
| Insecticide: | September 9 | Lorsban® @ 600mL/ha |
| Fungicide: | June 22 | Propiconazole® @ 300mL/ha |
| August 6 | Prosaro® @ 300mL/ha + BS100 0.25% |
Method
A replicated field trial was sown using a complete randomised block design. It was analysed as a threeway analysis of variance (ANOVA).
Assessments included establishment counts, Normalised Difference Vegetative Index (NDVI), maturity biomass, harvest index (measurement of biomass:grain ratio) and grain yield and quality parameters.
The trial had two seed sizes, two sowing rates and five P rates applied (Table 1).
Table 1. Treatment descriptions for Compass barley.
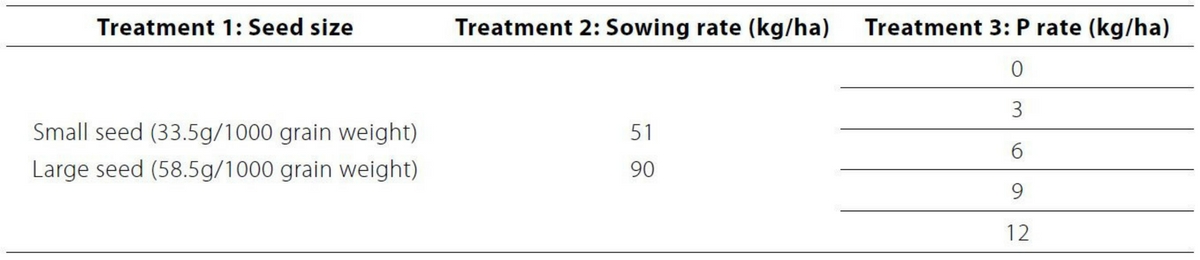
The 2015 season seed was 25g lighter in 1000 grain weight compared to the 2016 season seed which translated to a 39kg/ha difference in sowing rates to achieve optimal plant populations. Both seed sources achieved 100% germination.
The sowing rate was determined based on calibration for a target density of 130 plants/m2 using the following calculation:

Phosphorous rates were selected to be higher, lower and around district practice which averages 5-10kg/ha in the Wimmera and Mallee.
Results and interpretation
Does seed size and sowing rate make a difference to barley yield and quality?
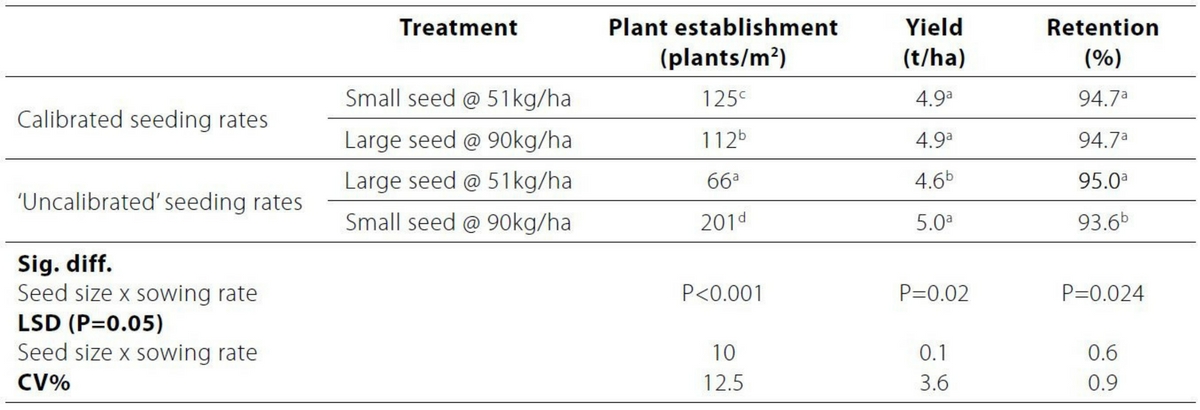
Small seed sown at a calibrated rate of 51kg/ha achieved the same yield as the large seed sown at its calibrated rate of 90kg/ha (Table 2). Treatments representing an ‘uncalibrated’ sowing scenario which were not corrected for seed size, (ie. large seed sown at a low rate (51kg/ha) achieved poor early vigour (NDVI) due to reduced plant numbers resulting in a 0.3t/ha yield penalty. Small seed sown at 90 kg/ha produced slightly lower retention, however it was still within malt specifications (greater than 70%). There were no differences within other grain quality parameters.
Table 2 summarises the results where there were statistically significant differences between treatments with an interaction between seed size and sowing rate.
Early crop development
Seed size and sowing rate influenced early crop growth because there were significant differences between all treatments measured in establishment counts (Table 2).
This was expected for the treatment with large seed and a low sowing rate which produced 66 plants/m2 and for the small seed and high sowing rate treatment which produced 201 plants/m2.
The significant difference between treatments sown to the same target plant population (51kg/ha of small seed and 90kg/ha of large seed) is not as well understood and more difficult to explain.
Table 2. The interaction between barley seed size and sowing rate for plant establishment, grain yield and retention. (Data averaged across all P rate treatments)
Differences in seed size and sowing rate were also captured in fortnightly NDVI assessments that were taken from 15 June until mid-stem elongation at the end of August (data not shown). As expected, the plots with 66 plants/m2 recorded a significantly lower NDVI reading than plots with 201 plants/m2 because there were less plants, therefore less ‘greenness’ to measure.
Does phosphorous rate make a difference to barley yield?
The trial site was classified as ‘very low’ for Diffuse Gradient Thin Film testing (DGT) and ‘low’ for Colwell P/PBI soil test results.
Significant responses to P were measured in the ‘greenness’ of the crop via regular NDVI sensors (Figure 1), biomass cuts taken at maturity and in yield measured in tonnes/ha (Figure 1).
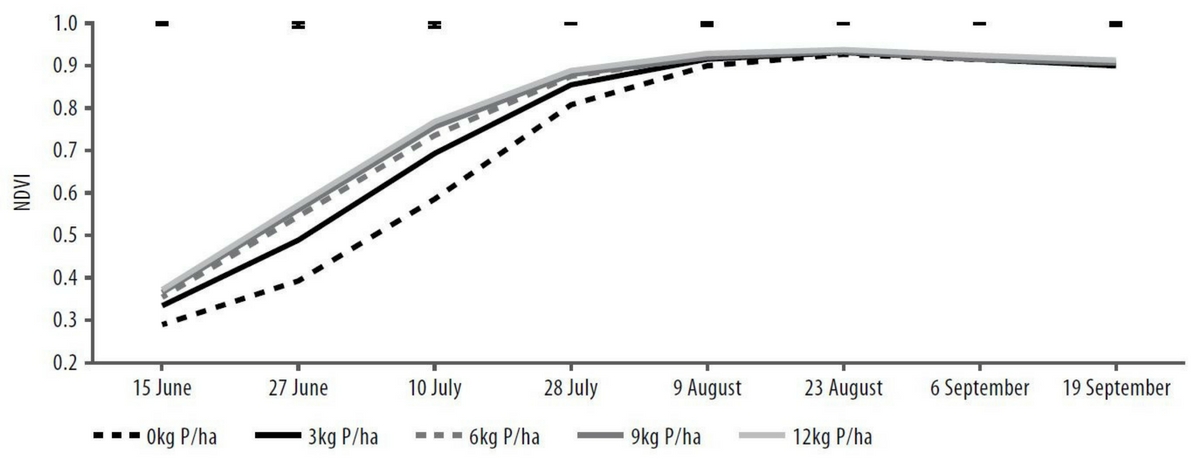
Responses to P fertiliser are typically observed in the early growth stages of a crop however in this trial, NDVI assessments captured differences in ‘canopy greenness’ according to P rates 130 days after sowing (up until mid-late stem elongation). Apart from five individual treatment/assessments, there were significant responses to all P fertiliser rates over four months of assessment.
This was also reflected in maturation rates of the barley crop as there was an observed difference in maturity with delayed development in the 0P treatments approximately 7-10 days behind the others.
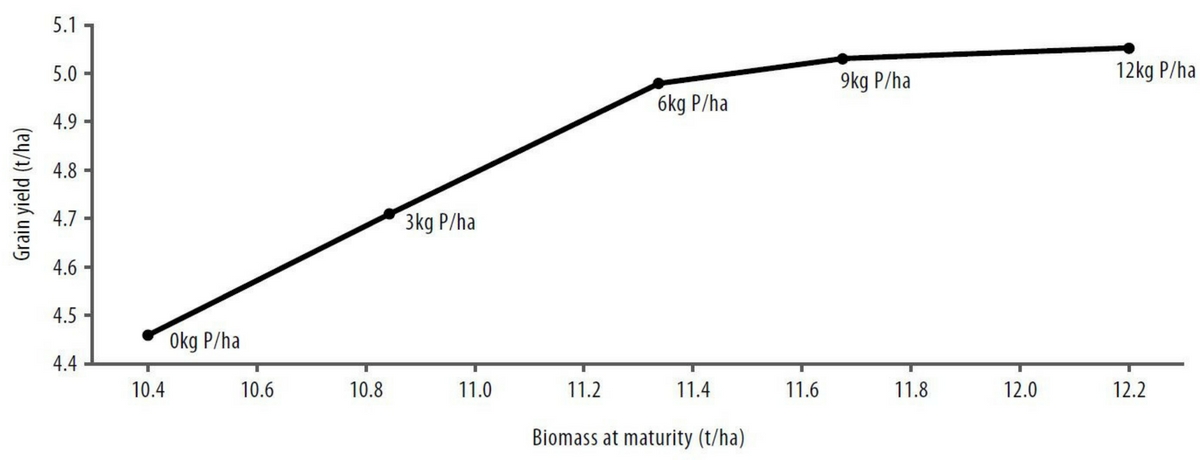
In grain yield, there was a significant response to added P from 0 to 3kg/ha and from 3 to 6kg/ha (Figure 2). After this point, there was no additional yield benefit, suggesting the optimal P rate at this site was around 6kg P/ha, or approximately 27kg/ha of MAP.
There were no differences in grain quality parameters, harvest index or thousand grain weight as influenced by P.
Grain yield came from increased biomass because there were no significant changes in harvest index. This highlights the importance of P for plant growth.
Commercial practice and on farm profitability
Calibration care factor
Growers should check their grain weight, the germination of retained seed and calibrate their seeder accordingly to achieve consistent plant establishment from season to season. In this trial there were minimal yield implications from seeding densities between 100 -200 plants/m2. However there was a significant 0.3t/ha, or $60/ha (F1 barley, Birchip delivered) yield penalty from sowing at 66 plants/m2.
In contrast, sowing a crop with 70 plants/m2 in excess of the recommended target plant population (200 plants/m2), slightly lowered retention which was not enough to result in a downgrade however sowing a surplus 40 kg/ha, put the grower an unnecessary $8/ha out of pocket. This highlights that not calibrating a seeder can produce a loss in yield, quality and income in barley.
Don’t run down your soil P reserves, and do your sums
A yield and biomass penalty from not applying adequate P were the largest limitations noted in this trial.
P deficiencies are difficult to correct after sowing and soil testing is an effect way to estimate soil P supply and ensure P is applied at an appropriate rate.
Despite significant responses to P observed in NDVI up to mid-stem elongation, there was no additional benefit to applying more than 6kg P/ha, the equivalent of 27kg/ha of MAP at $650t ($17/ha for 6kg P/ha).
There may be implications for a 7-10 day lagging maturity observed in the 0kg P/ha rate treatment. The impact of this on a cropping program probably depends on the issues at hand, if the crop is early, a delay may reduce frost risk, on the other hand if heat is a concern, low P status may increase risk of heat stress.
References
Poole N., 2005, ‘Cereal Growth Stages’, Grains Research and Development Corporation.
Acknowledgements
This research was funded by the GRDC as part of the ‘Maintaining profitable farming systems in retained stubble’ project (BWD00024) and BCG members through their membership.
