Take home messages
- Grazed crops showed no effects from grazing in 2016 – an excellent season producing high early biomass. Crops recovered and yielded very well.
- Trojan and LRPB Arrow were the best dual purpose wheat varieties.
- Fathom, Spartacus and Rosalind were the best dual purpose barley varieties.
Background
A mixed farming system that comprises of crops and livestock is a strategy for managing risk in Wimmera and Mallee farm businesses. However, in a predominant cropping program, where grass and broadleaf weeds are controlled to reduce the seedbank under the next crop, there is less pasture land and feed available to sheep during late autumn and winter.
An early sown cereal crop can provide feed for sheep in this situation, and if managed and grazed within some guidelines, can recover and produce grain. Grain & Graze trials have found that early sowing, variety choice, early grazing before GS30, and leaving residual leaf and soil moisture will minimise grain yield penalties in low to medium rainfall areas (see 2011-2016 BCG Season Research Results).
Grazing will not always incur yield penalties. In some situations, often in heavier crops, grazing of barley results in higher yields due to managing the canopy, minimising lodging and reducing disease. Grazing a crop has also been shown to increase yield because grazing has delayed maturity and subsequently avoided frosts. This is particularly important when short season, temperature responsive cereals are sown early and, if left ungrazed, would have a high likelihood of being impacted by frost.
Aim
To evaluate how new and existing wheat and barley varieties respond to grazing and post-grazing nitrogen (N) application rates.
Paddock details
| Location: | Warmur |
| Annual rainfall: | 444mm |
| GSR (Apr-Oct): | 371mm |
| Soil type: | Clay loam |
| Paddock history: | 2015 fallow |
Trial details

Pests, disease and weeds were controlled according to best management practice.
Method
Grazing x nitrogen response, grazing wheat and grazing barley trials were sown in randomised complete block design.
Assessments included establishment counts, NDVI (normalised difference vegetation index – measure of crop greenness), dry matter (DM) biomass cuts at GS30 (feed available for grazing) and GS65 (anthesis biomass – response to grazing and different N application rates), grain yield and quality parameters.
Feed tests were analysed on composite samples for wheat and barley variety trials. Using DM and feed tests, dry sheep equivalent (DSE) grazing days were calculated as follows:
DSE grazing days = [DM (kg/ha) – 30kg wastage] x feed test metabolisable energy (ME) / 8 MJ, which assumes that each DSE requires 8 MJ ME/day.
Grazing x nitrogen response and grazing barley trials were grazed on 30 June (simulated with a slasher), and the grazing wheat trial was grazed on 14 July (with a whipper-snipper). All trials were grazed at GS30 to a height of 8cm, leaving green leaf to assist with plant recovery.
Note that all trials received the one single graze at GS30, a safer practice in lower rainfall areas when minimising the impact of grazing on grain yield. Repeated grazing (two or three times) between GS13 and GS20 (up to GS30), such as that practiced in high rainfall regions, is likely to have had a different impact on phenology, GS30 date and yield results.
Results and interpretation
The Warmur trial site received no rain for the month of April, but once rain fell in early May, good rainfall continued throughout the season, with September rainfall more than triple the average for that month. Overall 2016 was a Decile 9 year, following two Decile 1 seasons.
Grazing x nitrogen response
At GS30 (28 June, grazing time) Trojan had a biomass of 0.4t/ha, while Mace had almost twice the grazing value with 0.7t/ha. Feed tests for both varieties indicated very high protein (Trojan 32.7 per cent, Mace 30.2 per cent), energy (Trojan 12.3, Mace 12.0 MJ ME/kg DM) and digestibility (Trojan 81 per cent, Mace 78.9 per cent). Trojan therefore produced enough feed for 527 DSE grazing days/ha, and Mace 1017 DSE grazing days/ha.
To allow some plant regrowth after grazing, post-grazing N rate applications were applied one week after grazing. Grazing removes biomass and, unless the crop is grown with luxury levels of N from seeding, the application of N is an attempt to recover as much DM prior to flowering. In the absence of ‘haying off’, higher DM at anthesis should result in higher grain yields.
Seven weeks later on 22 August, Trojan and Mace in DM, recorded similar NDVI measures. At that time, grazing treatments had recovered, and there was no difference in response to the different in-crop N rate applications.
By anthesis (GS65) however, the different varieties still had similar DM across treatments on average, but they had different recovery responses to grazing (P=0.007, LSD=0.772). Longer growing season Trojan was able to recover (both 8t/ha) whereas earlier maturing grazed Mace (6.9t/ha) had 1.6t/ha less DM at anthesis compared with ungrazed Mace (8.5t/ha).
As more N was applied, DM on average increased: 0N 7.3t/ha, 10N 7.6t/ha, 25N 7.8t/ha, 50N 8.6t/ha, 75N 7.9t/ha (P=0.045, LSD=0.86) but the response was variable for the variety x grazing treatments (Figure 1), and the 75kg N/ha in-crop N application didn’t always produce the highest DM.

Figure 1. Anthesis DM of grazed and ungrazed Mace and Trojan, with different N rates, Warmur 2016. Note: error bars are for variety x N rate x grazing treatment, P=0.043, LSD=1.726, CV=15.5%.
Grain yield was affected by the individual treatments. Trojan out-yielded Mace by 0.9t/ha (P<0.001) with grazing reducing yield, albeit by a small 0.1t/ha (P=0.005). There was an increasing grain yield response to N rate (Figure 2): 0N 4.6t/ha, 10N 4.8t/ha, 25N 5t/ha, 50N 5.3t/ha and 75N 5.5t/ha (P<0.001, LSD=0.064).
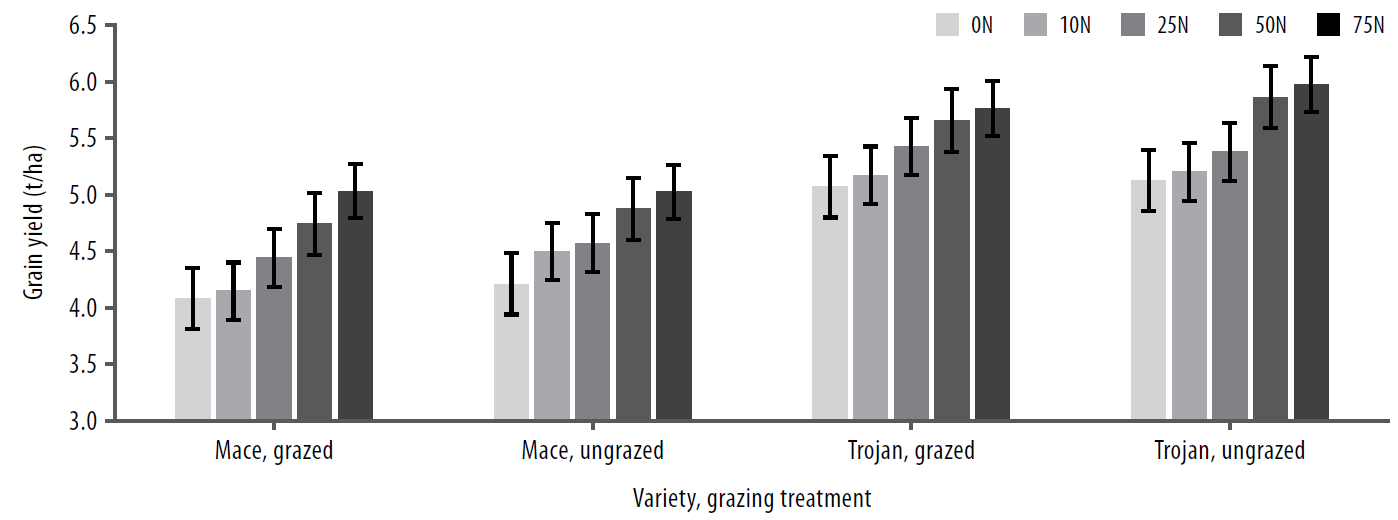
Figure 2. Grain yield of grazed and ungrazed Mace and Trojan, with different N rates, Warmur 2016. Note: error bars are for variety x N rate x grazing treatment, P=NS (0.264), LSD=0.257, CV =3.6%.
Grazing did not affect grain protein or screening levels. Protein differed between variety (Mace 10.1 per cent, Trojan nine per cent, P<0.001) and N rates (increased from nine to 10.4 per cent as N rate increased from 0 to 75kg N/ha, P<0.001). Screenings were low across the trial, and only differed between varieties by 0.4 per cent.
The increased variability of anthesis dry matter response to N application compared to the grain yields (Figure 1 vs Figure 2) may arise from sampling techniques. DM is sampled from relatively small areas compared to a whole plot for grain. This may incur variation in cut height, and there can be compensation during grain filling that produces similar grain yields from variable dry matter yields at anthesis.
In 2016, the application of N to grazed crops allowed for greater recovery of that crop to produce grain. In this season, the ungrazed crops showed the same increasing yield response. In previous drier years at Berriwillock and Navan in South Australia, that relationship was not as clear, when Mace positively responded to increasing N, while Trojan grain yield declined, particularly for grazed crops (Frischke 2015).
Grazing wheat varieties
Plant establishment was even across varieties, averaging 110 plants/m2.
The nutritional value of all wheat varieties was high (Table 1) and would provide excellent feed for all classes of sheep. Feed value, based on metabolisable energy and GS30 DM (Table 2), ranged from 440 to 1151 DSE grazing days (Table 1) with LRPB Arrow the best performing variety averaging 0.8t/ha. This was followed by winter wheat Wedgetail at 0.6t/ha (Table 2). All plots were sampled on 13 July.
Table 1. Feed test analysis of grazing wheat varieties. Samples taken at GS30 before grazing event.

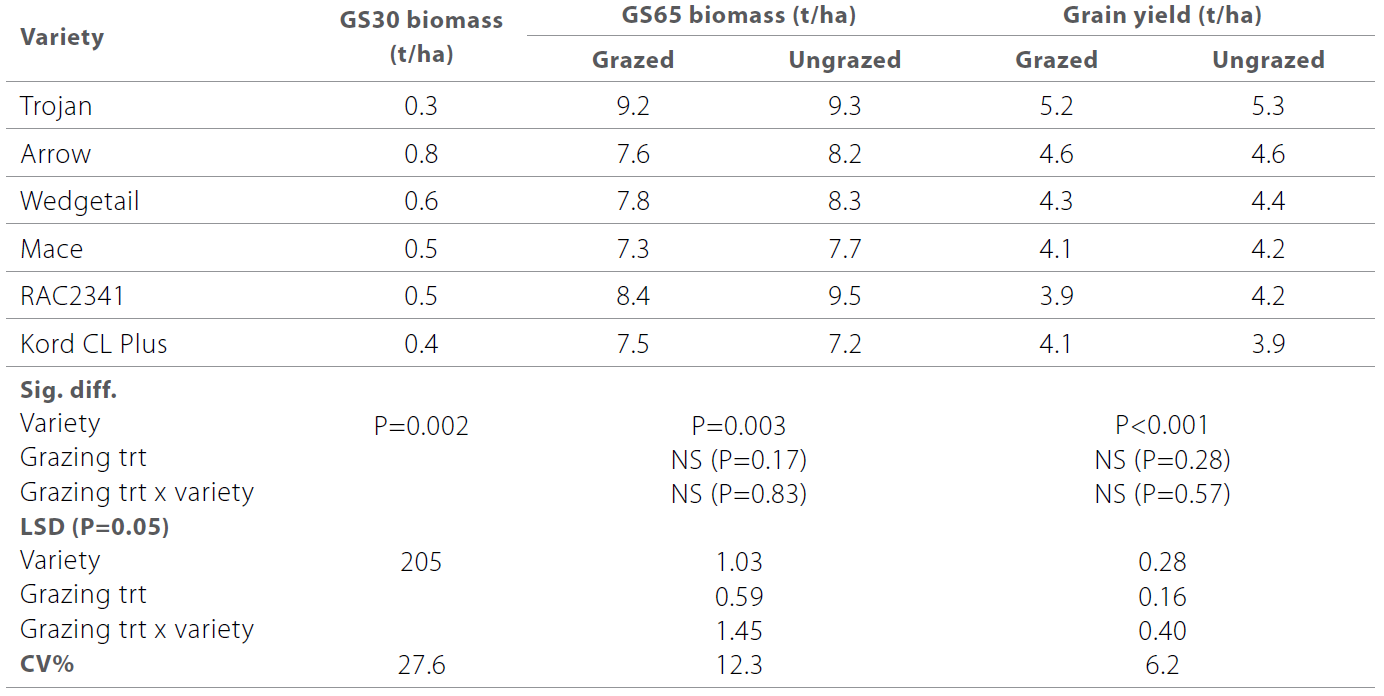
Plants recovered well after grazing, and by anthesis there were no significant biomass differences between grazed and ungrazed crops. Only variety differences occurred, with Trojan producing a high 9.2t/ha and RAC2341 (a fast maturing winter type) 9t/ha (Table 2).
The favorable season, and biomass recovery by grazed crops, also meant there was no effect of grazing on grain yield, with only variety differences occurring. Trojan topped the yield chart with 5.2t/ha, followed by LRPB Arrow at 4.6t/ha (Table 2). Long growing season conditions suited EGA Wedgetail (performing similarly to LRPB Arrow), while the faster maturing varieties appear to have peaked a little early. Kord grain yield responded to grazing, increasing by 0.4t/ha.
Table 2. Early and anthesis dry matter, and grain yield of grazed and ungrazed wheat varieties.
The high yielding season lowered grain protein, ranging from 9.5-10 per cent across varieties, except RAC2341 which had higher protein at 11.2 per cent. Grazing reduced protein (P=0.053) by 0.6 per cent. Screenings were low and test weight was adequate for all treatments.
Grazing barley varieties
The nutritional value of all barley varieties was high (Table 3) and would provide excellent feed for all classes of sheep. Feed value ranged from 752 to 1339 DSE grazing days (Table 3) and was highest for Compass, Fathom, Rosalind and Scope producing between 0.7 and 0.9kg DM/ha (Table 4). All plots were sampled on 30 June.
Table 3. Barley variety feed test results from GS30 biomass cuts.

Barley also recovered well after grazing, producing large amounts of biomass. While there was no interaction between grazing and variety, on average, grazing reduced anthesis biomass by 0.7t/ha on average compared with ungrazed crops (Table 4).
Grain yields were very high. Fathom topped the yields at 7.6t/ha, and was unaffected by grazing. Other varieties had a variable yield response to grazing with high yielding Spartacus 0.6t/ha lower and other varieties ranging from 0.2 to 0.4t/ha lower. Compass was an exception, responding favourably to grazing with a 0.3t/ha increase in grain yield.
Table 4. Early and anthesis dry matter, and grain yield of grazed and ungrazed barley varieties.

Commercial practice
The 2016 season was above average which allowed wheat and barley crops to respond to increasing in-crop N applications and recover after grazing. Varieties that had later maturity benefited from the late finish.
The value of a crop for grazing will depend on how much early biomass it can produce, as well as the ability for it to recover and produce quality grain. However, even if a variety has lower early biomass, for example Trojan compared with Mace, it still provides useful grazing value. The conditions in 2016 allowed Trojan to grow on and yield higher than Mace, making it a handy dual purpose crop.
The success of grazing a crop is a combination of how the season has started and how hard the crop is grazed, followed by the ability of the crop to grow on after grazing (adequate moisture, nutrients and growing season length), and fill grain. Consideration should also be given to managing livestock across the farm, not just in a single paddock. This involves placing grazing animals (often pregnant or lambing ewes) on good feed, letting pastures establish, and allowing livestock to reduce stubble loads after harvest to improve future manageability.
In lower rainfall areas, crops can really only be grazed once, and preferably early (GS13 onwards) if yield penalties are to be avoided. Avoid reaching GS30. In higher rainfall areas however, farm practice is usually an early grazing from GS13, followed with repeat grazing up to GS20 (can be to GS30). Grain & Graze trials in South Australia have indicated there is little difference in the total DM production to GS30 irrespective of the number of grazing events, but the impact on plant phenology and recovery to yield might be different and is still being explored.
On-farm profitability
With low grain prices and sound livestock prices in 2016, any yield penalties from grazing would be quickly recovered financially and offset by easier management.
For example, a cereal crop grazed at GS30, that has an available biomass of 0.5t DM/ha with 12.5MJ ME/kg DM, provides 780 DSE grazing days. Using a ball park $35 profit/DSE (sheep) (NSW DPI, 2016), the grazing partial gross margin is 780/365×35=$75 profit/ha. This year grade H1 wheat was $210/t and malt barley $150/t. Assuming crops achieved these grades, average yield losses were compensated by grazing value (0.1t/ha yield loss for wheat = $21/ha, and 0.2t/ha yield loss for barley = $30/ha). In most cases the yield loss was less than 0.5t/ha, or there was no yield loss.
Grazing doesn’t always result in yield loss, and has been proven to be a sound way to reduce the risk of sowing early that normally results in maturing in adverse conditions.
References
Frischke, A., 2015, 2015 BCG Season Research Results, ‘Grazed wheat crop responses’ pp. 151-155.
NSW DPI, 2016, ‘Sheep Enterprises improve further in 2016’.
Acknowledgements
This research was funded by the GRDC as part of the Grain & Graze 3 – Southern Region project (SFS00028).
