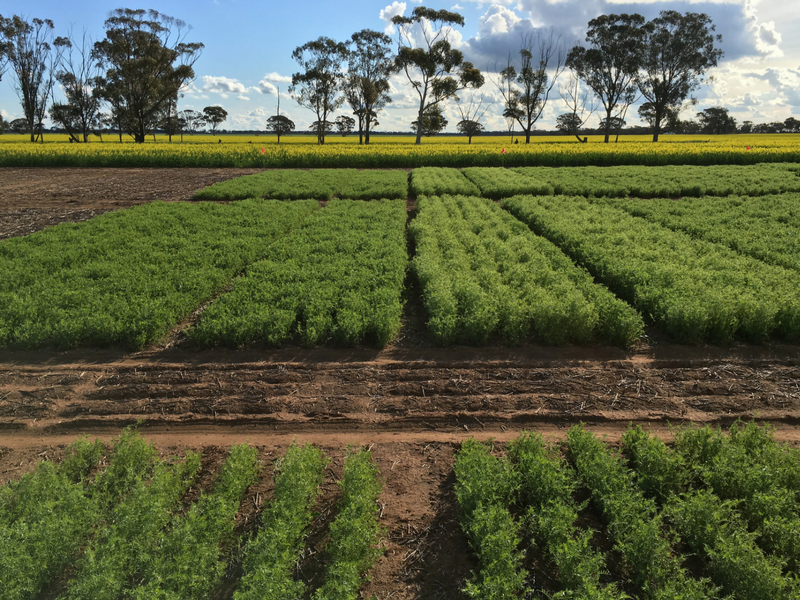
The Mallee and Wimmera is looking a picture and canola is starting to turn the country side yellow. Disease seems to be at the front and centre of our minds -remember to get out of the ute and have a good look when inspecting for disease in crops. Table 1. Rainfall and deciles across the Wimmera and Mallee. DURATION (MM) OUYEN MANANG’ SWAN HILL SEA LAKE BIRCHIP HOPET’N CHARLTON RUP’ W’BEAL LONGY NHILL KANIVA BOORT Jan – July 169 (5) 148 (4) 176 (4) 195 (5) 191 (5) 203 (5) 262 (7) 310 (8) 238 (6) 245 (6) 239 (6) 295 (8) 260 (7) GSR (Apr-July) 123 (6) 102 (4) 117 (5) 134 (6) 144 (6) 119 (5) 181 (6) 213 (8) 174 (7) 176 (6) 152 (4) 193 (5) 175 (7) August (1-15) 15 19 19 18 12 9 22 28 12 20 10 11 26 Climate Predictions for average to slightly above average rainfall over spring remain, with summer rainfall now looking to be average. Spring temperatures are also predicted to be average. The IOD- shows some signs of weakening but models predict it will continue for the next three months. There’s still an outside chance of a La Niña but it will be a weak one if it does occur (Source: Dale Grey, Agriculture Victoria). There is a strong forecast for 9-13mm in the Mallee and 14-18mm in the Wimmera late Thursday night through to early Friday morning. Forecasts for a wet harvest are not strong this year, so bear this in mind when planning for harvest. Temperatures This year continues to be warm, with the warmest on record from January 1 to August and the third highest growing season on record. This is due to the higher minimum temperatures as opposed to higher day time temperatures. Figure 1. Accumulated heat-sum base 0 for the January to August season compared to historical events (days since season start). Yield Prophet, Warmur The current growing season rainfall is a Decile 5 and equates to 50% probability on the grain yield outcome graph (Figure 2). Currently, the solid green line indicates a 50% probability of a 3.2t/ha wheat yield with the current nitrogen (N) supply, but with the addition of N the yield could increase to 3.7t/ha. Note: the dotted lines on the grain yield outcome graph represent the probable influence of frost and heat on yield. The gap between the dotted and solid lines converges as yield increases indicating that the effect of frost and heat shock is greater in the worse years with lighter yields. Figure 2. Yield Prophet® grain yield outcome for the main research site at Warmur. Insects RLEM, Oat aphids and Cowpea aphids have been found in vetch and cereal crops, continue to monitor and use sticky traps to identify the level of beneficials present. Russian Wheat Aphids, whilst their movement has slowed in recent months, they will be on the move as the temperatures increase. As we progress into the latergrowth stages, the threshold
This post is only available to members.