Take home messages
- Both zones and rates have to be right for variable rate application (VRA) to pay.
- Test strips are a useful tool for assessing paddock variability and fertiliser rates.
- Knowledge of the underlying causes of variability will enable appropriate zoning.
Background
Variable rate application (VRA, also known as Site-Specific Crop Management) involves applying fertiliser, chemicals, seed, or other inputs at varying rates across a single paddock. Economic benefits vary, but savings as high as $57/ha have been reported from the VRA of fertiliser in highly variable paddocks in Australian grain farms (Robertson et al. 2007).
Although VRA has relatively high adoption in the Mallee and Wimmera compared to the rest of Australia, there is still significant room for improvement. For many growers in the region, being able to confidently identify the right zones and apply the right management are major barriers, even when they already have the required machinery for implementation (Robertson et al. 2012).
To help support increased adoption of VRA in areas where it makes sense, and to help growers who already practice VRA to refine their approach, BCG commenced long-term, paddock-scale trials in 2016 to demonstrate and assess real-world approaches to VRA in the Mallee-Wimmera. These trials will also investigate the practical value of PA technologies such as yield maps, UAVs, satellites and soil mapping machinery. Using these technologies to assess variability and outcomes across the paddock will help illustrate how they can be used profitably in farmers’ own systems.
Aim
To demonstrate and assess the effectiveness of an existing VRA system to capture and manage paddock variability in the 2016 season.
Paddock details
| Location: | Manangatang |
| Annual rainfall: | 387mm |
| GSR (Apr-Oct): | 294mm |
| Soil type: | Variable |
| Paddock history: | 2015 Oura field peas |
Trial details
| Crop type: | Corack wheat |
| Treatments: | Refer to Table 1 |
| Target plant density: | Refer to Table 1 |
| Seeding equipment: | Knife points, press wheels, 30cm row spacing |
| Sowing date: | 4 May |
| Harvest date: | 6 December |
Trial inputs
| Fertiliser: | Refer to Table 1 | |
| Herbicide: | 26 June | LVE MCPA 570 @ 300mL/ha + Lontrel™ @ 100mL/ha |
| Seed treatment/inoculant: | Raxil® T @ 1L/t |
Method
In 2016, a long-term paddock-scale trial was established on a variable dune-swale paddock in Manangatang. This paddock has already been managed by the farmer using a zone-based VRA system since 2005. Four management zones, based on visually observed changes in soil type and landscape, were used to vary seed rate and nitrogen fertilisers across the trial area. Phosphorus (P) fertiliser was also applied using a replacement strategy based on the previous-season’s yield maps. However, based on observations, the grower believes that the location of some zones should be changed, and that paddock outcomes could also be improved by increasing the number of zones.
Test strips were sown the length of the paddock using a replicated control design, including at least two replicates of each treatment. Four treatments were used as per Table 1. Assessments included soil testing, biomass cuts, NDVI and true-colour imagery collection by UAV and satellite, and yield mapping.
Table 1. Treatments applied in 2016.
Results and interpretation
The extent to which the existing zones can capture nitrogen (N) and P response variability across the trial area was used as a basic indicator of performance in 2016. The fundamental requirement of VRA is that there is sufficient variability within the paddock, and also that the pattern of variability is stable enough to manage effectively (GRDC 2006). However, variability can take many forms, and the kind of variability that zones attempt to capture and manage can differ depending on the system and strategy. Nevertheless, when VRA fertiliser is focused on increasing profits, the goal will be to apply the Economically Optimal Nutrient Rate (EONR) that maximises returns for each zone. The EONR is affected by the yield response to fertiliser, and grain and fertiliser prices (Abadi and Farre 2015). This means that
differences in N and P responsiveness across the paddock will have the biggest impact on appropriate zoning and optimal rates.
It is also important to note that no general conclusions should be made about the performance of a variable rate system based on single-season results, particularly in a season as exceptional as 2016. A multi-year approach is particularly important in order to account for temporal variability, the potential for certain soil types and areas to respond very differently to changes in seasonal rainfall and other conditions, and to better assess the effects of the variable rate system on risk management and long-term economic outcomes. Consequently, BCG will continue to conduct relevant trials as part of this project until at least 2018.
Observed variability in 2016
The paddock was sown on 4 May and received Decile 9 rainfall over the growing season, which helped magnify the differences in biomass and vigour between treatment strips that were obvious both visually and in NDVI imagery from an early stage. Initial large variability in average NDVI readings across the paddock within the fixed rate treatment strips gave some indication of the large degree of underlying spatial variability not related to treatment effects (CV=23.4%). A comparison between treatment strips indicated that this variability encompassed differences in both N response and P response. Geographically weighted regression was used to further extend and generalise the analysis of these responses over the whole trial area.
Nitrogen response
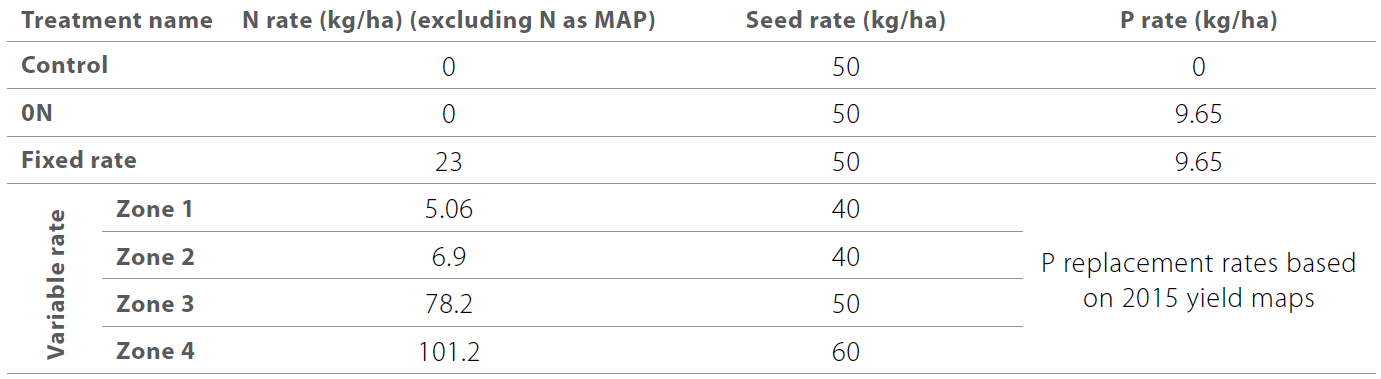
NDVI imagery taken by drone on August 2 (GS33) showed significantly higher average NDVI readings for the fixed rate strips compared to 0N, demonstrating that an N response had occurred across the trial area (P<0.001). The variation of the N response at each point along the length of the trial area, calculated as the difference in NDVI between these two strips, gave some general support to a zoning approach based on elevation and landscape (Figure 1). The highest N response occurred close to hill tops, with a moderate response on flats. The lowest N response was generally observed on the slopes, with the exception of an area on the southern slope of the southern hill.
The N response pattern shown in yield maps was similar. Under the fixed rate treatment, highest yields were generally achieved on hill tops, the lowest on slopes, and relatively moderate yields on flats. The response to N, visible in a comparison of yields between fixed rate and 0N treatments, was similar and had reasonable correspondence to that shown in NDVI, with higher responsiveness on hill tops and flats, and lower on slopes (Figure 2). A particularly large drop in yield and yield response to N was observed in these strips on the southern slope of the southern hill, despite being in an area with a higher N response observed in NDVI. This could suggest an additional underlying constraint at that point that is not necessarily related to nitrogen, or where timing of NDVI may have more of an impact.
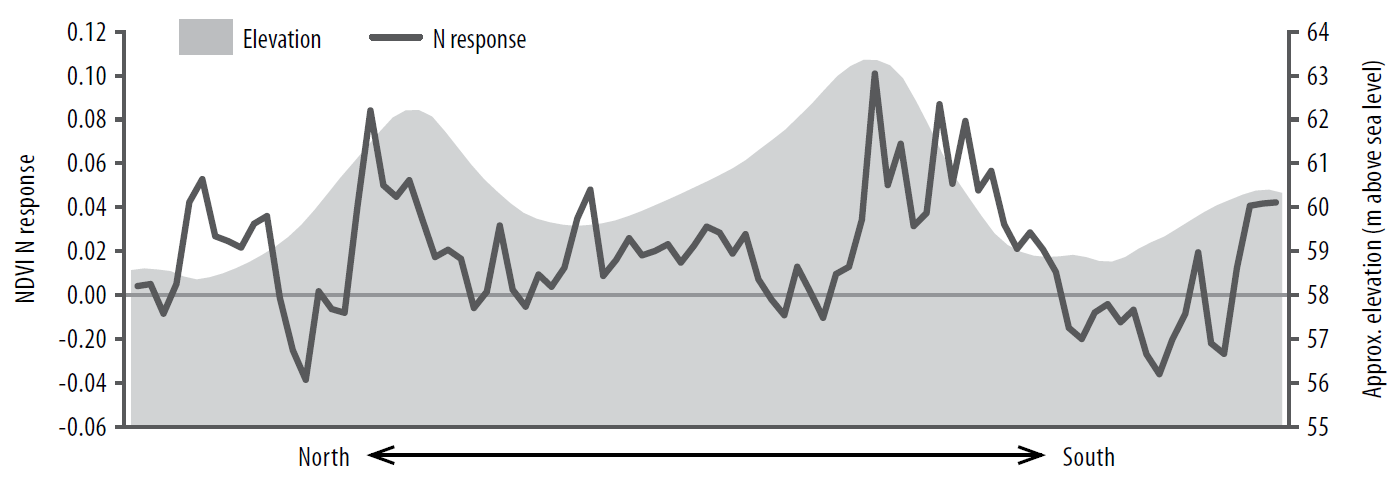
Figure 1. Average N response across the trial area on 2 August. The N response is calculated as the difference in average NDVI at each point between the fixed and 0N treatment strips. The bottom axis represents a progression from the northern end of the trial area (left) to the southern end (right), a distance of approximately 1km. Elevation is represented by the shaded area, to give an indication of the landscape across the trial site.
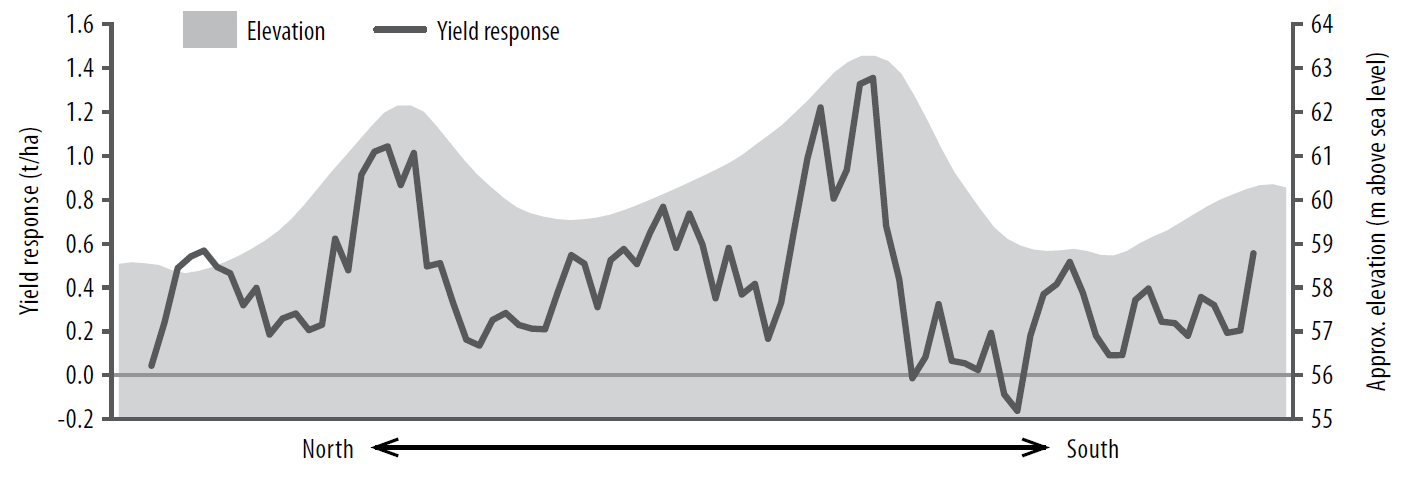
Figure 2. Average yield response to applied N across the trial area. The yield response is calculated as the difference in average yield at each point between the fixed and 0N treatment strips.
The existing VRA zone and N rate approach was not fully consistent with these general patterns in 2016 (Figure 3). A large degree of variability remained within certain individual zones. In particular, both the highest and lowest yields and yield responses occurred within zones that received a high N rate.
Figure 3. Variable N rate across the trial area. The N rate is calculated as the average
prescription per the zone map at each point, for the fixed and control treatment strips.
Phosphorus response
A comparison between the control and 0N treatment strips similarly indicated a significant general P response across the paddock (P<0.001). To some extent, a larger P response was observed on hill tops and slopes, and a lower response on flats, but there was a large degree of variability across the site (Figure 4). There was some broad similarity in the distribution of P responsiveness over the trial area with the P replacement zones constructed from 2015 yield maps, but not in terms of the rates used for these zones (Figure 5). For example, a high observed P response area in the southern part of the trial area appeared to fall equally into low, moderate, and high P-rate zones.
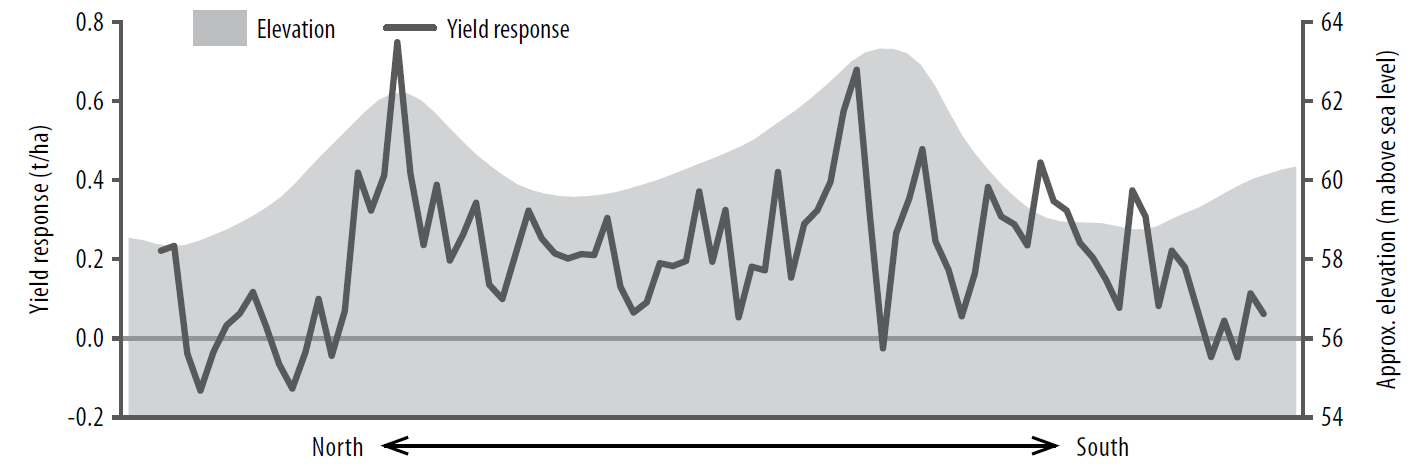
Figure 4. Average yield response to applied P across the trial area. The yield response is calculated as the difference in average yield at each point between the 0N (ie. fixed rate of P only) and control treatment strips.
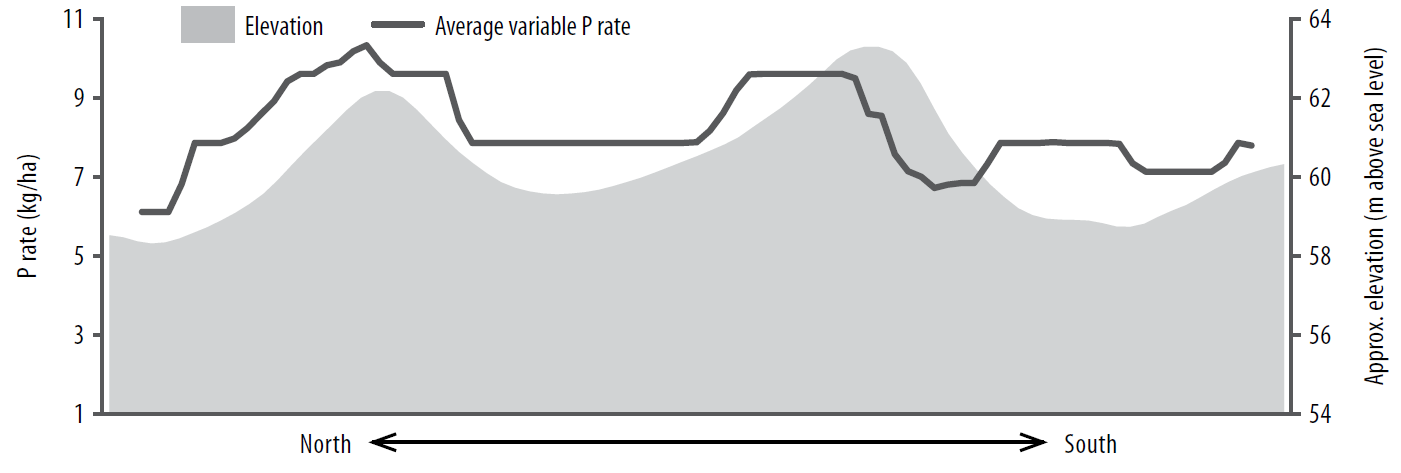
Figure 5. Variable P rate across the trial area. The P rate is calculated as the average prescription per the P replacement map at each point, for the 0N and control treatment strips.
Economic indicators of performance
There was no significant difference in average yield between the variable (3.27t/ha) and fixed rate (3.22t/ha) treatment strips (P=0.170), but the very large disparity in average input rates between these treatments means a direct economic comparison may have limited value. However, some broad observations can be made by comparing the differences in net income between the two treatments across the trial area. This suggested that the variable rates applied in the flats were sub-optimal, since the relatively higher inputs in the fixed rate treatment also tended to achieve a higher net income in these areas. Similarly, higher variable rate inputs at several areas on the slopes resulted in a relatively lower net income, suggesting excessive rates at these points.
Commercial practice
These results provide interesting implications for the existing VRA approach, but should be interpreted in the context of 2016 seasonal conditions. With this in mind, the existing variable rate practice appeared to have mixed success at predicting crop responses in the trial area in 2016.
The zones located in flats (zone 1, 2) were reasonably consistent in their response to N, suggesting that the area of this zone is well defined, but the relatively good N response could have justified a higher N rate. However, this is likely to be a reflection of 2016 conditions, with heavier soil types in these areas likely to perform poorly in less exceptional seasons.
Slope areas did not appear consistent enough to be treated as a single zone (zone 3), with the southern slope of the southern sand hill in particular worthy of further investigation. The performance of the slopes did not generally justify the higher N rates applied under the VRA system.
Hill top zones (zone 4) in the trial appear to have been too broadly defined in 2016, since they captured both very high and very low response areas. The southern side of the southern hill displayed particularly unique behaviour, which suggests that a change in zone at that point may be justified.
The observed patterns of P response did not correspond strongly to the P replacement approach. Within such a variable paddock, this approach may be too simplistic. The variation not explained by previous seasons’ P removal could indicate strong underlying differences in important soil characteristics, such as the Phosphorus Buffering Index (PBI).
Indeed, a detailed understanding of underlying soil properties could be valuable in explaining
the observations from across the paddock in 2016 and beyond. This may allow for a more general assessment of zone boundaries as well as potentially indicating where additional management techniques may be justified. Consequently, EC and pH maps have been commissioned and will be completed by early 2017. The results will be used to provide more context for 2016 and future results from this trial.
More generally, these results indicate the importance of getting both zones and rate right for the season to make VRT pay. The 0N, control, and fixed rate test strips used in this trial are a useful tool for other growers to gain more insight into variability across a paddock. An N-rich strip may also have potential value for determining appropriate N rates across the paddock, based on the fact that the N response observed in GS32 NDVI between the control and fixed rate treatments was generally a good predictor of yield response. This would involve applying a very high rate of N in a strip across the paddock, and using the difference in NDVI values between this strip and the neighbouring crop as an indicator of where additional N is potentially justified (Norton 2014, Poole and Hooper 2012).
References
GRDC, 2006. Precision Agriculture Manual.
Norton, R., 2014. Nitrogen management – how much is enough and how much is too much?
Acknowledgements
BCG acknowledges the extensive assistance of the farmer in performing this trial.
This research was funded by the Hugh Williamson Foundation and the Telematics Trust.
Ultimate Positioning Group (UPG) provided valuable assistance with UAV data collection.
