Take home messages
- When the maximum rate of nitrogen (N) was applied, La Trobe achieved malt grade and the
greatest profitability. - Fathom was the most N efficient variety, converting the most supplied nitrogen to grain,
whereas Compass and Commander were the least responsive. - The highest rate of N (120kg N/ha) was the most profitable for all varieties in a Decile 10
growing season
Background
This trial was conducted as part of the tri-state funded GRDC Barley agronomy for the southern region project, aimed at developing variety specific management packages for newly released barley varieties.
Barley varieties with different genetics vary in their plant architecture and growth patterns which can influence their response to nitrogen (N). This paper investigates whether barley varieties respond differently to the amount of N applied at sowing and whether growers should be implementing N management packages tailored to each variety to deliver optimum profit.
Aim
To assess the response of six barley varieties treated with five different N rates at sowing.
Paddock details
| Location: | Quambatook |
| Annual rainfall: | 515mm |
| GSR (Apr-Oct): | 378mm |
| Soil type: | Sandy clay loam |
| Starting soil N: | 37kg N/ha |
| Paddock history: | 2015 wheat |
Trial details
| Crop type: | Barley |
| Treatments: | 1. Varieties: Commander, Compass, Fathom, GrangeR, La Trobe and Scope CL 2. Nitrogen rate: 0, 30, 60, 90 and 120kg N/ha |
| Trial design: | Randomised complete block design |
| Target plant density: | 140 plants/m² |
| Seeding equipment: | Knife points, press wheels, 30cm row spacing |
| Sowing date: | 18 May |
| Replicates: | Four |
| Harvest date: | Yield analysis in this report is from samples collected at maturity on 15 November. The trial was harvested in full on 18 December. |
Trial inputs
| Fertiliser: | Nitrogen as per treatment list in trial details. | |
| Herbicide: | 18 May
7 July
20 July
26 August |
Glyphosate @ 2L/ha + Trifluralin @ 1.5L/ha + Avadex® @ 2L/ha (at sowing)
Affinity Force® @ 100mL/ha + Thistle Killem® @ 330mL/ha + LontrelTM Advanced @ 100mL/ha Axial® @ 300mL/ha + Hasten @ 0.5% (GS30) Velocity® @ 670mL/ha + Lontrel 300 @ 100mL/ha |
| Insecticide: | 20 September | LorsbanTM 500 EC @ 200 mL/ha + Genwet 1000 @ 0.25% |
| Fungicide: | 20 July
20 September |
Propicon® 550 EC @ 230mL/ha (GS30)
Prosaro® 420 SC @ 300mL/ha |
Method
A replicated trial was established at Quambatook using a randomised block design. The trial included five nitrogen rates:
0kg N/ha (control)
30kg N/ha (65kg/ha urea)
60kg N/ha (130kg/ha urea)
90kg N/ha (195kg/ha urea)
120kg N/ha (261kg/ha urea)
Nitrogen treatments were spread prior to sowing and incorporated into the soil with the seeder.
Assessments and data collection included:
- Plant density after establishment at GS12
- Greenseeker Normalised Difference Vegetation Index (NDVI) at GS21, GS30 and GS59
- Crop biomass and grain yield at maturity from hand harvests taken November 15
- Visual assessment of lodging (percentage of plot affected) • Machine harvest yield (December 18)
- Grain quality including protein, moisture, retention, test weight and screenings.
Results and interpretation
The trial was sown into a moist soil bed and emerged well with follow up rain in late May and early June. Starting soil nitrogen was very low (37kg N/ha) and as a consequence, there were early visual differences between nitrogen treatments.
By maturity (GS99) in mid-November, due to the above average rainfall during the season, secondary tillers formed in all treatments. At this time, biomass cuts were taken to measure biomass differences between varieties and nitrogen rates. As a result of the secondary tillering, harvest was delayed to mid-December, which led to yield losses in all plots (not variety or N rate specific) caused by severe head loss. The cuts taken at maturity were therefore used to calculate yield (t/ha) for all plots (instead of yield off the header).
Early growth
Plant establishment was excellent although GrangeR plant numbers were below the target of
140 plants/m2 (Table 1).
Table 1. Variety establishment counts taken at GS12. Stats: P<0.001, LSD=10 plants/m2, CV=10.5%.

The low soil nitrogen supply at sowing resulted in a site with high N demand and yield potential. NDVI measurements taken at GS30 show significant differences among each nitrogen rate independent of variety (Figure 1). Differences in greenness and ground cover were also observed between some varieties independent of N rates.
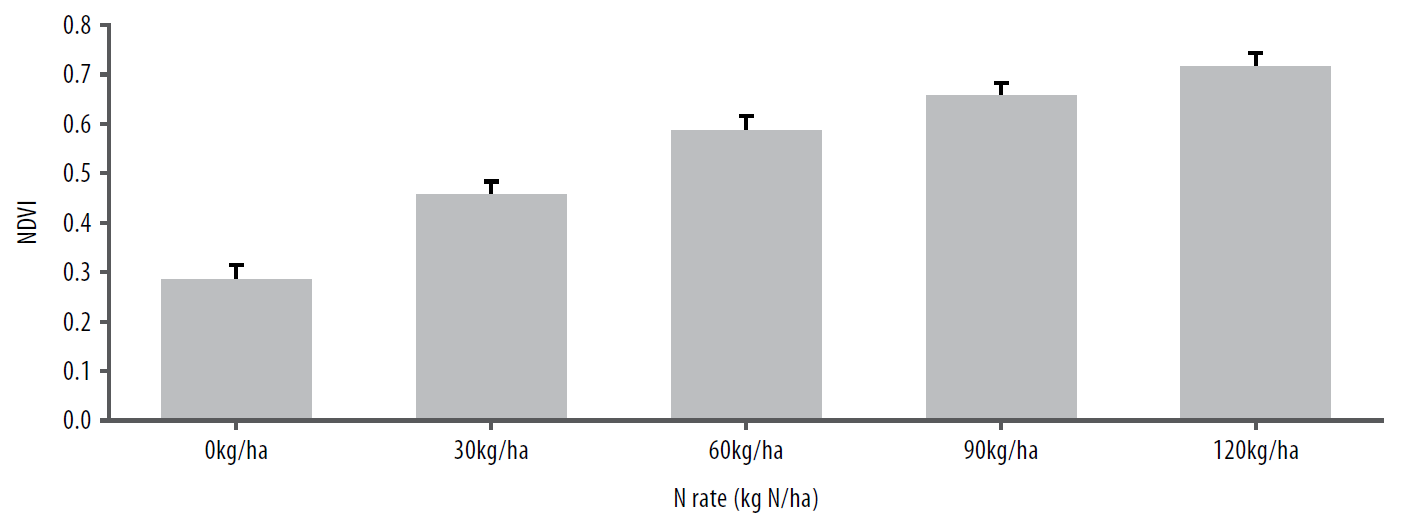
Figure 1. NDVI as influenced by N rate at GS30. Stats: P<0.001, LSD=0.03, CV=9.5%.
All varieties were significantly different from each other apart from GrangeR and Commander (Figure 2).
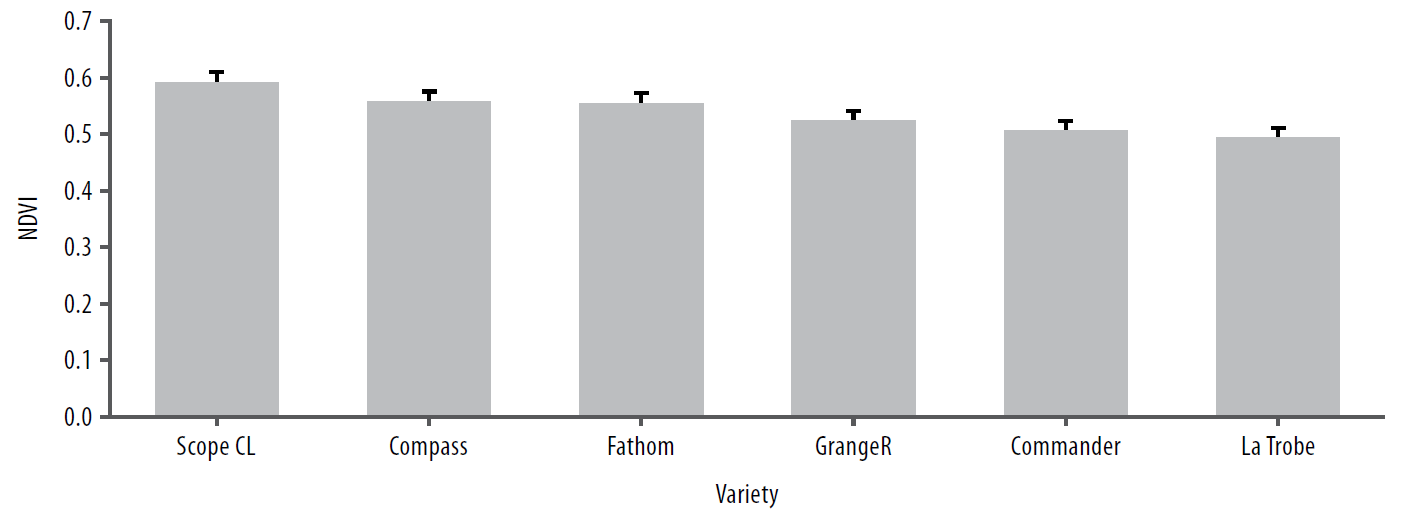
Figure 2. NDVI measurements by variety at GS30. Stats: P<0.001, LSD=0.02, CV=7.2%.
Did the varieties yield differently?
Varietal differences were evident with GrangeR and Fathom yielding significantly higher than Commander or Compass (Figure 3). Mean varietal yields ranged from around 4t/ha for Compass and Commander to over 5t/ha for GrangeR and Fathom. GrangeR, a mid to late maturing variety, was favoured by the late season rains, and cool spring conditions. Variety differences are discussed in more detail in article ‘Barley varieties and time of sowing’ page 70.
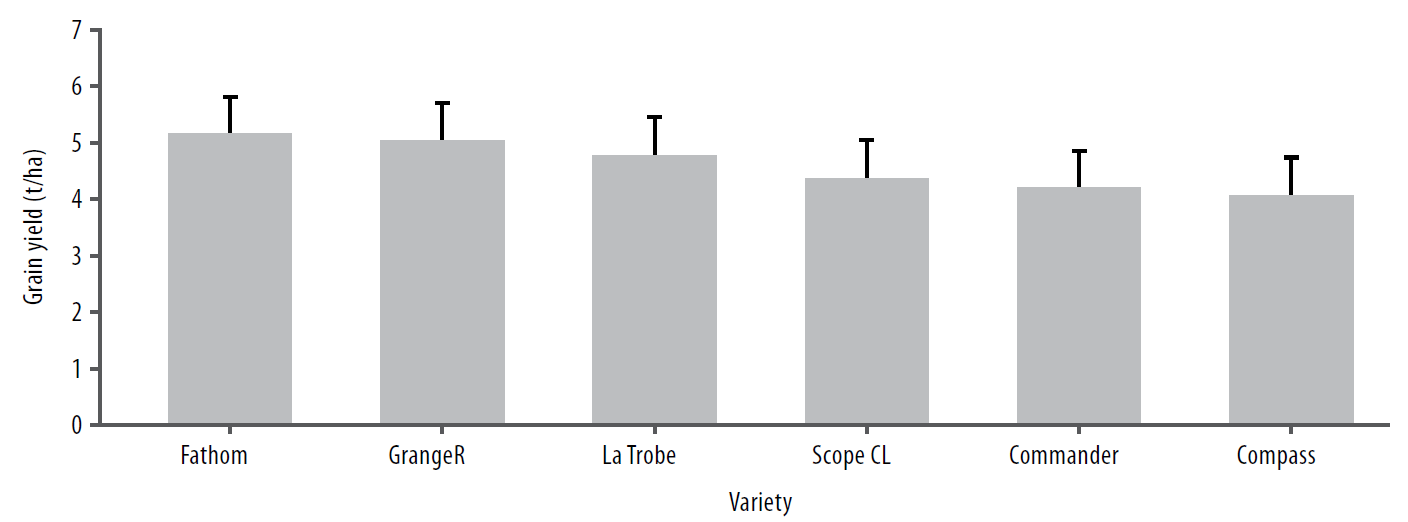
Figure 3. Change in grain yield by variety. Stats: P=0.007, LSD=0.68t/ha, CV=23.5%.
Did the nitrogen rates yield differently?
As expected, the site was highly responsive to nitrogen with the highest N rate almost doubling yield, compared to no nitrogen applied (Figure 4).
Site yield potential, as estimated using French-Schultz for a cereal crop, was 5.5t/ha which was exceeded by the 120kg N/ha treatment, despite an estimated additional 120kg N/ha required to achieve such a yield (Table 2). Similarly, the nil treatment and the 60kg/ha treatment which would be expected to yield between 3 and 4t/ha exceeded 5t/ha. This suggests N mineralisation during spring was sufficient to supply the additional N required.
Table 2. Barley nitrogen budget at Quambatook*.

*based on 37kg N/ha, 31mm rainfall at sowing and 35kg N/ha estimated mineralisation
District practice N rates of 30 to 60kg N/ha, which normally target 3 to 4t/ha yield, achieved 4 and 5t/ha respectively but were significantly lower in yield than the maximum N rate in this Decile 10 season (Figure 4). This was independent of variety.
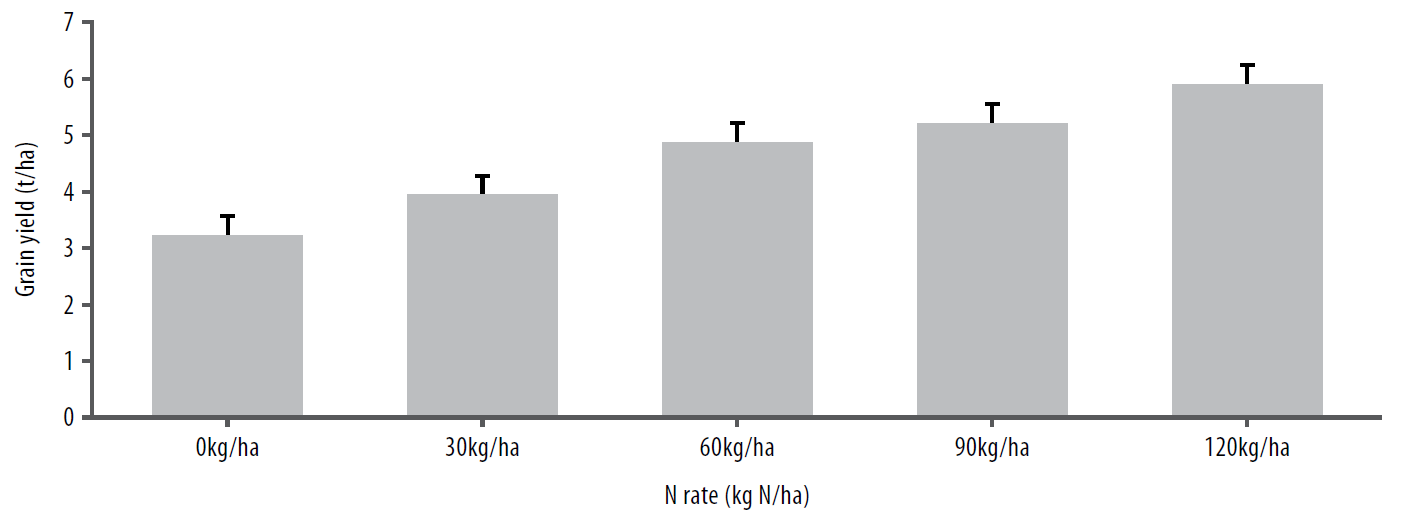
Figure 4. Change in grain yield with increasing rates of nitrogen applied at sowing.
Stats: P<0.001, LSD=0.36t/ha, CV=13.5%.
Did varieties yield differently in response to nitrogen supply?
La Trobe was the highest yielding variety at the highest nitrogen rate (120kg N/ha), also achieving malt grade. Feed accredited Fathom however, yielded higher than La Trobe at the other lower N rates and its yield from 120kg N/ha treatment was not significantly different to La Trobe’s. GrangeR was the highest yielding variety at the nil, 30kg N/ha and 60kg N/ha rates and yielded similarly to La Trobe and Fathom at 120kg N/ha but didn’t achieve malt grade in this instance. Commander and Compass had the lowest yields at all N rates applied.
Grain yield and protein for each variety and N rate is listed in Table 3. Screenings were low and grain retention and test weight were all within malt specifications, however, grain protein was below malt specifications for all treatments except La Trobe and Scope CL at 120kg N/ha (Table 3).
Table 3. Effect of nitrogen rate on yield and protein for each variety.

*Malt grade achieved due to protein at or above 9.0 per cent and a malt accredited variety.
N by variety interactions were statistically significant as illustrated in Figure 5, suggesting that there are differences in a varieties ability to utilise supplied N and convert this into grain. GrangeR with 60kg and 90kg N/ha appear to have an unexplained anomaly so caution is required with interpretation.
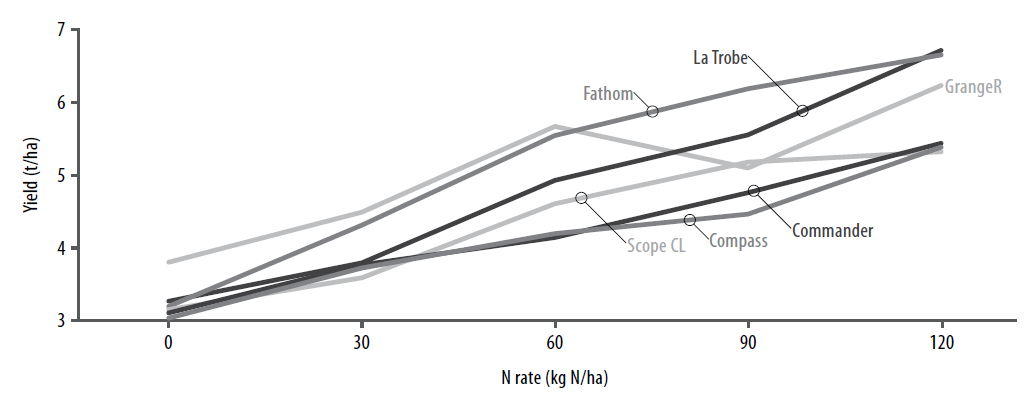
Figure 5. Grain yield response in six barley varieties to five N rates applied at sowing.
Stats: P=0.002, LSD=0.6t/ha, CV=9.1%.
Which variety achieved more yield from less nitrogen?
Varietal differences in grain N uptake is presented in Figure 6. All varieties responded to nitrogen with Fathom the most N efficient, converting the most supplied nitrogen to grain. Compass and Commander had the flattest N uptake curves indicating they were the least responsive to the nitrogen applied.
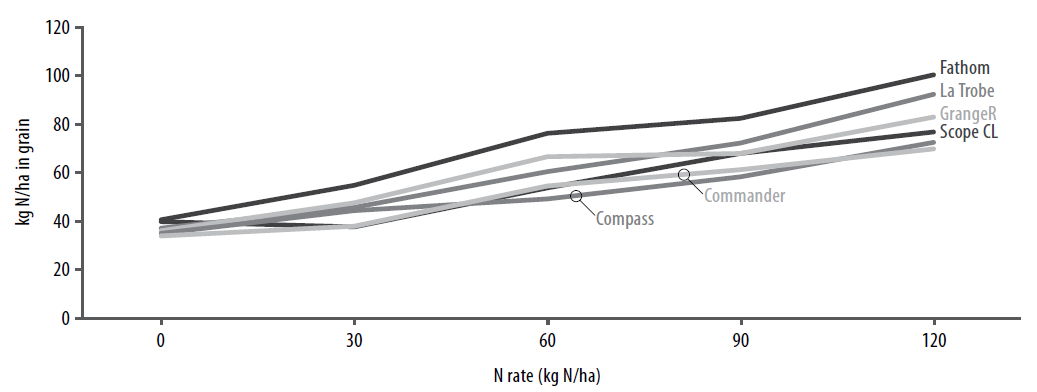
Figure 6. Grain N uptake for each variety and N treatment.
On farm profitability
2016 was not only marked by Decile 10 growing season rainfall but also by extremely low grain prices with malt between $140 and $170/t, and feed below $130/t. In this analysis, a malt grade price of $144/t and feed grade price of $125/t were used (delivered Quambatook GrainCorp 29 December 2016).
Financial analysis of this trial revealed there wasn’t a clear cut advantage to growing malt for a price premium over feed grade, or vice versa. Partial gross margins (Gross income minus cost of urea) increased with yield but a malt grade did return a profit advantage.
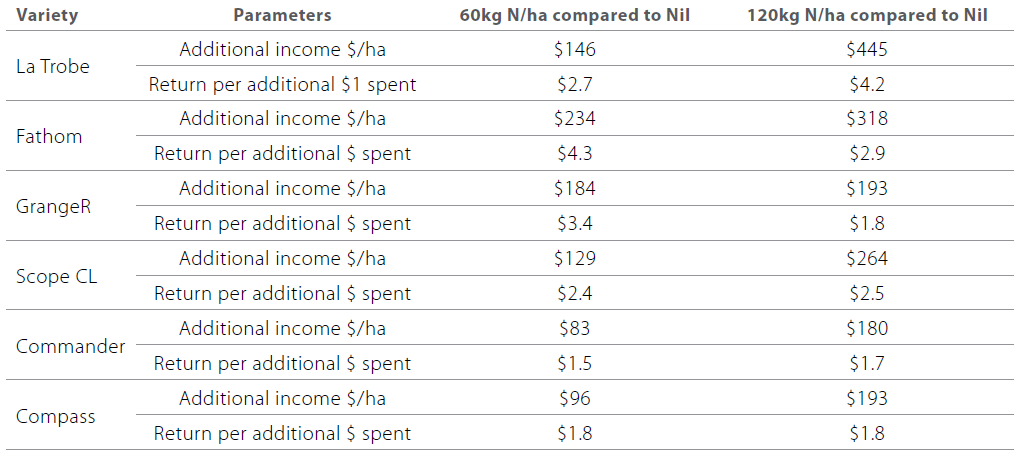
Despite the grain price spread being less than $20/t, there was a significant impact on income between the two highest yielding treatments. La Trobe (malt), had a higher partial gross margin than Fathom (feed) in the order of $140/ha which is a major advantage (Table 4).
The next two highest yielding varieties are both malt accredited. However, despite being high yielding, GrangeR did not make malt grade so its income was only marginally better than Scope CL which was lower yielding, but did make malt grade. Commander and Compass were the poorest income earners as they did not achieve malt and were lower in yield.
Table 4. Partial gross margins (PGM) and return on investment of varieties achieved from applying 0kg N/ha, 60kg N/ha ($54/ha) and 120kg N/ha rate ($107/ha).

*Malt grade pricing.
Which N rate was the most profitable?
There was a return of >$2 to $1 investment when comparing 0kg N/ha to 60kg N/ha for all varieties except Commander and Compass (Table 5). When comparing 0kg N/ha to 120kg N/ha, returns were still reasonable considering the error limits of the yield data (an LSD of 0.6t/ha). La Trobe, Fathom and Scope CL were >$2 to $1, with GrangeR returning $1.8 and Commander and Compass returning $1.7 to $1. Scope CL and Commander were more responsive to higher N rates and accordingly the 120kg N/ha yielded a higher return on investment than the 60kg N/ha rate.
Table 5. Return on investment of varieties achieved from applying 60kg N/ha ($54/ha) and 120kg N/ha rate ($107/ha).
Commercial practice
Applying high rates of N at sowing is considered risky, particularly in the event of a dry finish however, the exceptionally high spring rainfall and cooler temperatures of this season meant that more nitrogen resulted in a higher yield and, generally, more profit. The season resulted in the higher rates of N yielding the highest results and returning malt grade in the case of La Trobe and Scope CL. La Trobe, Fathom and GrangeR yielded the highest at the 120kg N/ha rate. Fathom was the most ‘nitrogen efficient’ variety as it converted more of the applied nitrogen to protein in grain than any other variety.
Although not tested in this trial, delaying nitrogen to manage seasonal risk can be achieved without yield loss in favourable seasons (Craig et al. 2010). Industry experience suggests that regular revision of yield potential throughout the season (Elliott and Burke 2015) and flexibly managing N with a combination of early application followed by top ups if required, can supply the N demand required to take financial advantage of seasons such as 2016 without taking too many risks early in the season.
References
Acknowledgements
This research was funded by the GRDC ‘Barley Agronomy for the Southern Region’ (DAN00173).
