Take home messages
- In the clay loam soils at Warmur, with a good fertiliser history and a Decile 10 season, there was no yield response from applying phosphorus, zinc or sulphur.
- Applying 80kg/ha of nitrogen was sufficient to meet crop requirements, and it was also the
most economic return on investment. - Soil testing prior to sowing is an important tool in order to understand the nutrient status of
your paddock and to ensure you do not make uneconomical fertiliser decisions.
Background
Over the past couple of decades an application of the right nutrient source or product at the right rate, right time and in the right place has been closely associated with agricultural sustainability (IPNI 2012). This is because fertilisers are the primary input cost, particularly in low to medium rainfall zones. Consequently, fertiliser budgeting is often one of the most complex decisions for farm businesses.
A wheat crop requires macronutrients such as nitrogen (N) for increased chlorophyll production for photosynthesis, and phosphorus (P) for root development, vigour and cell division. Other nutrients are also imperative for proteins for cellular structure (sulphur) and for the production of chlorophyll and carbohydrates (zinc) (Anderson and Garlinge 2000). Combine these requirements with unreliable rainfall, and fertiliser management is multifaceted. Under-fertilising impacts on yield potential and quality, whilst over-fertilising can cause haying off in cereal crops or no further grain yield increases, both of which impact negatively on farm profitability.
Soil sampling prior to sowing is imperative to understand the current moisture and nutrient status of soils. Having this knowledge means farmers can accurately match fertiliser inputs to crop demand, therefore supporting the fertiliser budgeting process.
Aim
To determine the yield response and economic return from varying rates of nitrogen, phosphorous, sulphur (S) and zinc (Zn) to wheat at sowing and in-season.
Paddock details
| Location: | Warmur |
| Annual rainfall: | 444mm |
| GSR (Apr-Oct): | 371mm |
| Soil type: | Clay loam |
| Paddock history: | 2013 fallow, 2014 Derrimut wheat, 2015 fallow |
Trial details
| Crop type: | Corack wheat |
| Treatments: | Refer to Table 1 |
| Target plant density: | 130 plants/m² |
| Seeding equipment: | Knife points, press wheels, 30cm row spacing |
| Sowing date: | 6 May |
| Replicates: | Four |
| Harvest date: | 11 December |
| Trial average yield: | 4.9t/ha |
Trial inputs
| Fertiliser: | Refer to Table 1 | |
| Herbicide: | 6 May
27 June |
Roundup® @ 2L/ha + TreflanTM @ 1.5L/ha
Liase @ 2% + LontrelTM Advanced @ 75mL/ha |
| Insecticide: | 9 August
7 September |
LorsbanTM @ 140mL/ha
LorsbanTM @ 400mL/ha |
| Fungicide: | 23 August | Prosaro® @ 300mL/ha + BS1000 @ 0.25% |
Pests, weeds and diseases were controlled to best management practice.
Method
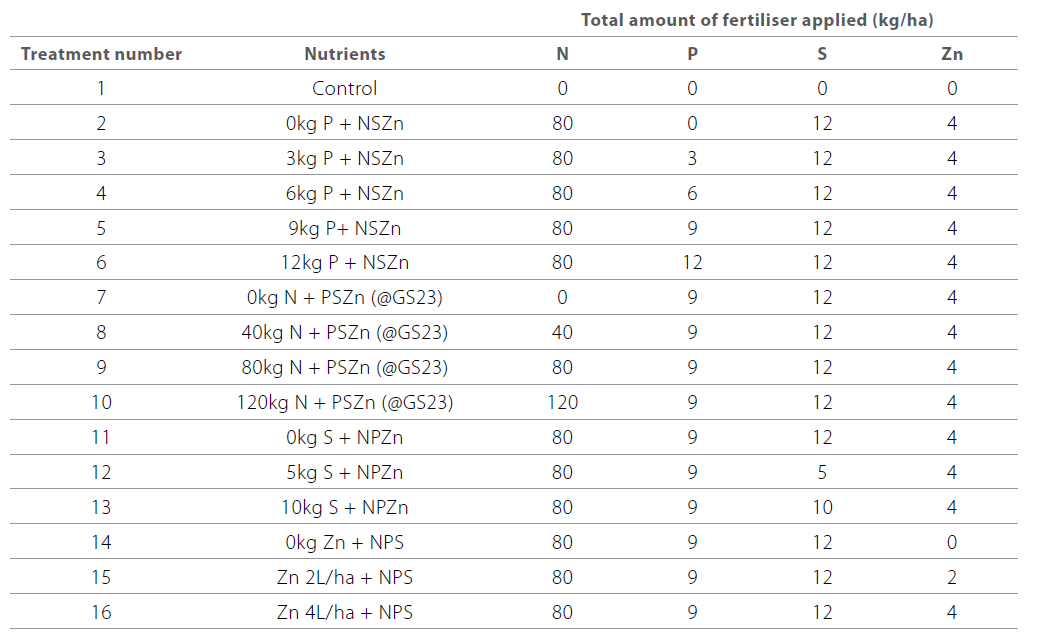
A replicated field trial was sown into a clay loam fallow at BCG’s main research site at Warmur. Soil sampling took place on 4 March and fertiliser balancing calculations were performed to ensure all treatments received the accurate rate of N, P, S and Zn as per the treatment list (Table 1).
All plots were sown with 10kg N/ha (except for the control and 0kg N/ha treatment) and 9kg P/ha (except for the P treatments). Sulphur and Zn was applied in-crop at GS23 using SOA (24% S) and ZincSol (16% Zn), respectively. The remaining N required for the N treatments was applied at GS23, and the other treatments were top-dressed to reach 80kg N/ha.
Table 1. The total amount of nitrogen, phosphorus, sulphur and zinc applied in this trial.
Normalised Difference Vegetative Index (NDVI) was measured on 29 June (GS23), 14 July (GS23/30), 3 August (GS33) and 23 September (GS65) using a handheld GreenSeeker. Head counts were performed on 10 October (GS73) in the phosphorus treatments only.
The trial was harvested with a Kingaroy plot harvester and grain samples were processed for yield and quality parameters. Statistical analyses were carried out using a one-way ANOVA with Genstat.
Results and interpretation
The research site recevied a staggering 371mm growing season rainfall (Decile 10) which translated into excellent yields. Soil sampling results from 4 March indicated 59mm of plant available water (PAW) to 70cm and 67kg/ha of starting soil N to one metre.
The P soil test results showed a Colwell P of 22mg/kg and a Phosphorus Buffering Index (PBI) of 59 equating to a critical Colwell P of 23mg/kg. The Diffusive Gradient Thin Films (DGT) measured 50ug/L where the current critical value for wheat response is 59ug/L with the marginal region being 50-69ug/L. Therefore, this paddock indicated marginal P status to 10cm.
The soil test results returned a marginal level of S to 10cm, but a very high level between 10 and 100cm. Zinc was not measured however previous results indicate that levels would have been satisfactory.
The site had sub-soil constraints including chloride levels of 1100mg/kg to 70cm and 1600mg/kg to 100cm. The maximum level is 800mg/kg before it impairs root growth. Boron at 40-70cm was 28mg/kg and 31mg/kg between 70 and 100cm which is toxic. Electrical conductivity was optimal to sub-optimal to 40cm however, it became almost toxic at 40-70cm and toxic between 70 and 100cm.
Throughout the season, differences were observed between treatments and confirmed with NDVI readings. These observations did not translate into significant (P<0.05) grain yield differences in phosphorus, zinc or sulphur which correlates with the soil test results which indicated no deficiencies in these nutrients.
NDVI (crop greenness)
The June and July NDVI results indicated that the 6, 9 and 12kg P treatments were significantly higher than the 0kg P treatments (P<0.001 for June and July), but the 0 and 3kg P were equal to each other (Figure 1). By August, the NDVI results showed that the 3, 6, 9 and 12kg P were higher than the 0kg P treatment. However, none of the P NDVI results translated into grain yield differences.
The July NDVI readings showed no differences between N rates (the urea was applied on 29 June, 15 days prior to NDVI measurement), indicating the crop was at a growth stage where demand for N was still low (prior to GS30). The NDVI measurement on 3 August indicated a significant (P=0.002) response to N applications up to the two highest N rates where there was little additional wheat response between 80kg N and 120kg N.
There were no differences in the zinc and sulphur treatments at any of the NDVI measurement dates.
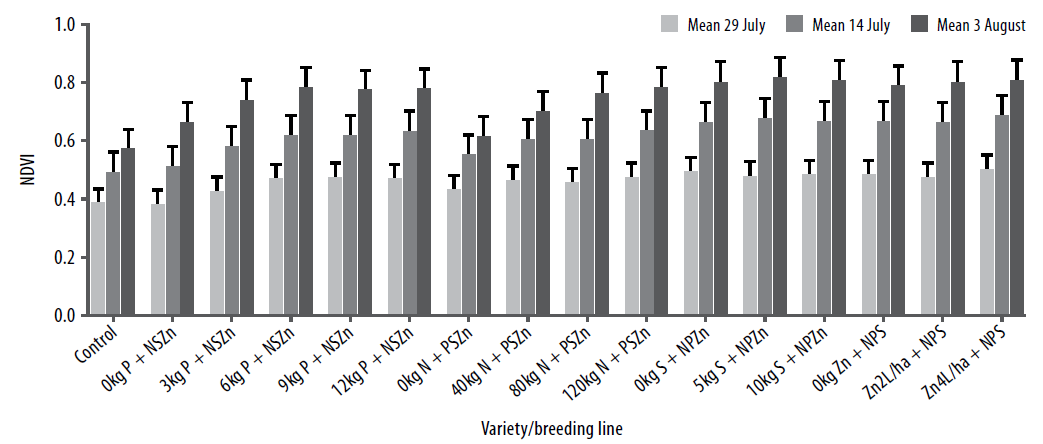
Figure 1. The NDVI average of each treatment measured in June, July and August. (June stats: P<0.001, LSD=0.05, CV=7.7%, July stats: P<0.001, LSD=0.07, CV=7.8%, August stats: P<0.001, LSD=0.07, CV=6.2%).
Grain yield and protein
Phosphorus
Even though there were early vegetative differences (growth) with increasing P applications (assessed by NDVI), there were no significant differences between grain yield or protein (Figure 2). This is reflective of the soil test results which indicated marginal P in the top 10cm. Even in a high yielding year like 2016, where crops have a greater requirement for P, they also develop a more extensive root system and can expand their exploration of available P sources in the surface soil to compensate. These results confirm previous BCG research that show that where there has been good fertiliser history it is difficult to get a yield response from P in soils which have a low ability to fix applications (as indicated by low PBI values).
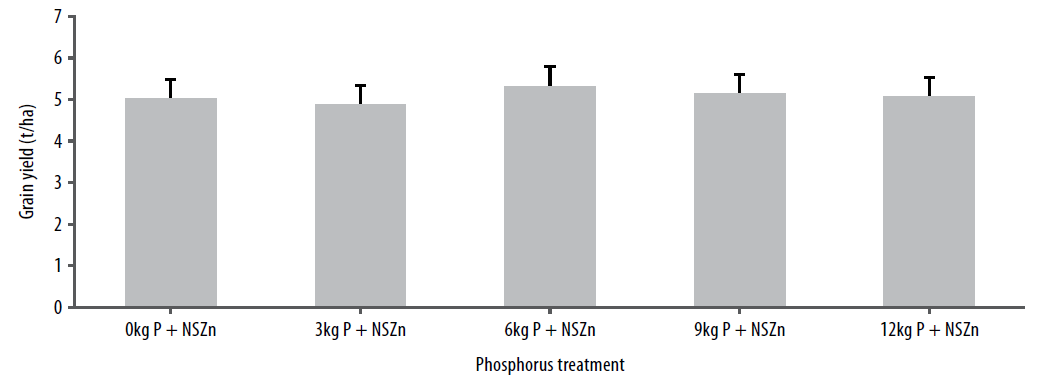
Figure 2. Phosphorus treatments and resulting grain yields. Stats: P=0.416, LSD=0.50, CV=6.4%.
Nitrogen
Disregarding rainfall, N is the biggest influencer of grain yield. In this trial, there were differences in grain yield to increasing N rates up to 80kg/ha however, there was no further yield response by increasing the N rate to 120kg N/ha (Figure 3).
Grain protein strongly correlated to grain yield with increasing protein values up to 80kg N/ha. No further response to the highest N rate was obtained, even though grain protein levels were relatively low at approximately 10 per cent.
Possible explanations for no increase in yield from applying 80kg N/ha to 120kg N/ha could be the result of subsoil constraints, leaching or denitrification due to waterlogging at the site. In-season soil sampling would determine whether the nitrogen remained in the soil and at what depth.
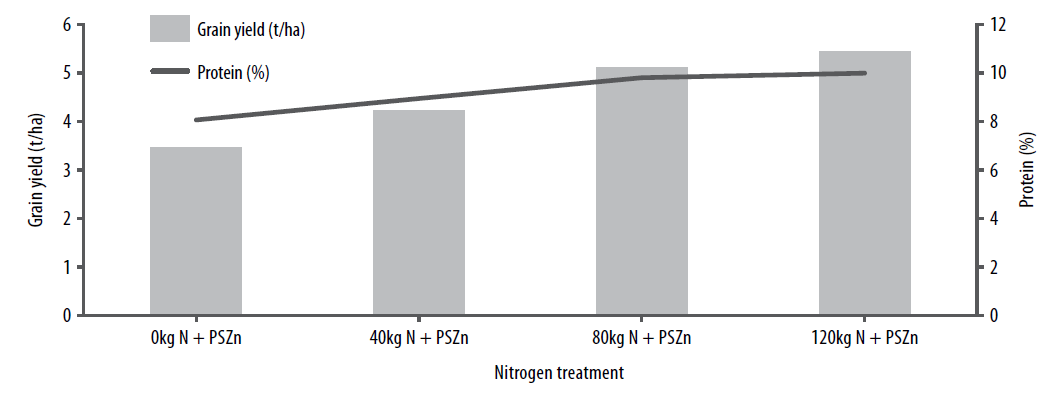
Figure 3. The grain yield and protein of each nitrogen treatment. Grain yield stats: P<0.001, LSD=0.4, CV=5.4%. Grain protein stats: P<0.001, LSD=0.72t/ha, CV=4.9%.
Sulphur and zinc
The soil test results indicated there was a very high sulphur status and as a result there was no differences between S treatments. There were also no differences in zinc treatments in this trial.
Commercial practice
The results indicate that in a Decile 10 season, and in a paddock with a good fertiliser history, there was no yield benefit from applying phosphorus, zinc or sulphur.
Soil testing this paddock again in 2017 will be important to ascertain what nutrients were removed in the grain in a high yielding year (2016), so that at least replacement fertiliser rates can be factored into management for this season’s crop.
Even though there was no yield response from the application of sulphur or zinc, it is good practice to keep an eye on these nutrients, which can be easily corrected in-season. Phosphorus however, needs to be applied up front due to its contribution to vigour and root development and its relative immobility in the soil.
The results we have observed in this trial draws a parallel with the soil test results which were taken at the beginning of the year. Farmers are encouraged to soil test their paddocks prior to sowing to gain a comprehensive understanding of their soil and nutrition status prior to making fertiliser decisions and budgeting. Ensuring an economic return is achieved for the applied fertiliser is paramount to long-term farm profitability.
On-farm profitability
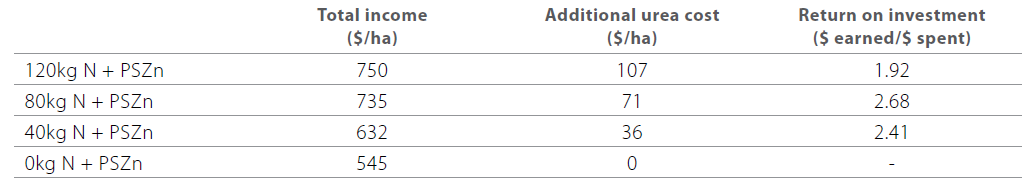
Nitrogen is the biggest driver of yield and therefore profitability. Using a urea price of $412/t, the partial gross margin carried out on the N treatments further endorses the research that indicated no economic benefit from applying an additional 40kg N/ha to reach 120kg N/ha.
The most economic return on investment when applying N in this paddock was the 80kg N/ha treatment because for every dollar spent there was a return of $2.68 (Table 2). To increase to the 120kg N/ha there was a reduced return on investment indicating it was not a viable economic decision.
Table 2. Partial gross margins on applying additional nitrogen. Stats: P<0.001, LSD=62, CV=5.9%.
Applying P, Zn and S, particularly at the higher rates in this paddock were an unwarranted cost in 2016 due to no yield responses being achieved. Even so, it would be wise not to become complacent and ignore these nutrients because if you continue to mine the soil without replacing what has been lost, it becomes more challenging to correct in future years.
Using a maintenance rate of approximately 3kg P with low PBI values has proven to be sufficient. Replacement rates need to increase on soils with greater PBI values to counteract the higher tie up of P sources on these soils. Nevertheless, soil testing remains the best method to help make informed decisions.
References
Anderson W.K, and Garlinge J.R., 2000, The Wheat Book. 1st ed. [Perth]: Dept. of Agriculture.
“History Of The 4 R’s”. Ipni.net. N.p., 2017. Web. 9 Jan. 2017.
Acknowledgements
This trial was funded by BCG members through their membership.
