Take home messages
- The timing (up-front vs in-crop) of nitrogen had a negligible effect on the yield or protein of wheat, barley and durum at Kalkee and Nhill in 2016.
- Despite deep banding seed, N fertiliser tissue damage was observed at the Nhill trial site. Caution should be taken with nitrogen applications at seeding.
- Previous research conducted by BCG on canopy management showed that delaying nitrogen applications until after the end of tillering can allow for a more accurate assessment of seasonal conditions to be made and money to be spent on nitrogen if a response is likely (BCG, 2006).
Background
Fertiliser inputs represent a significant proportion of total variable costs in grain production. Unfortunately, Australia’s variable climate means that there is significant variation in the amount of fertiliser which needs to be applied to optimise production each season. The difficultly for growers is knowing how much nitrogen (N) is required in each season and growers can often get caught, applying too much nitrogen which results in haying off, or not enough which results in poorer yields and low protein. This process is made even more difficult by adding the complexity of managing nitrogen for different crops which each a have a slightly different requirement.
Aim
To assess how wheat, durum wheat and barley respond to N applied up-front or in-crop throughout the growing season.
Paddock details
| Location: | Kalkee and Nhill | |
| Annual rainfall: | Kalkee
Nhill |
467mm
455mm |
| GSR (Apr-Oct): | Kalkee
Nhill |
374mm
339mm |
| Soil type: | Clay |
Trial details
| Crop types: | Derrimut wheat, Compass barley and WID-052 durum wheat |
| Treatments: | Refer to Tables 1 and 2 |
| Target plant density: | 140 plants/m² |
| Seeding equipment: | Knife points, press wheels, 30cm row spacing |
| Sowing date: | Nhill – 16 May, Kalkee – 19 May |
| Replicates: | Four |
| Harvest date: | Nhill – 22 December, Kalkee – 22 December |
| Trial average yield: | Nhill – 3.9t/ha; Kalkee – 5.1t/ha |
Trial inputs
| Fertiliser: | Granulock Supreme Z + Impact® @ 50kg/ha at sowing. Refer to Tables 1 and 2 |
| Seed treatment: | Wheat – Raxil® T Barley – Systiva® Durum – Raxil® T |
| Herbicide: | Nhill: | 16 May | RoundUp® @ 2L/ha + Triflur X® @ 1.5L/ha + Avadex® Xtra @ 2L/ha |
| 8 July | LontrelTM Advanced @ 100mL/ha + Velocity @ 670mL/ha + UptakeTM @ 0.5% | ||
| Kalkee: | 19 May | RoundUp® @ 2L/ha + Triflur X® @ 1.5L/ha + Avadex Xtra @ 2L/ha | |
| Fungicide: | Nhill: | 17 August | Prosaro® @ 300mL/ha + BS1000 @ 0.25% |
| 28 September | Prosaro® @ 300mL/ha + BS1000 @ 0.25% | ||
| Kalkee: | 16 August | Prosaro® @ 300mL/ha + Spreadwet @ 0.25% | |
| 27 September | Prosaro® @ 300mL/ha + BS1000 @ 0.25% | ||
| Insecticide: | Nhill: | 1 September | LorsbanTM @ 500mL/ha + BS1000 @ 0.25% |
| 28 September | LorsbanTM @ 500mL/ha + BS1000 @ 0.25% | ||
| Kalkee: | 12 September | Fastac® @ 250mL/ha + LorsbanTM @ 200mL/ha + BS1000 @ 0.25% |
Pests, weeds and diseases were managed according to best practice.
Method
Replicated field trials were established at the BCG Kalkee and Nhill research sites to investigate the effect of N timing on wheat and barley yield at Kalkee; and on wheat, barley and durum wheat at Nhill. All plots received identical agronomic management with the only difference being the N treatments (Table 1 and 2). Nitrogen fertiliser was applied as granular urea (46% N) ‘down the tube’ for up-front applications (split and up-front) and spread for in-crop application.
Trial assessments at Kalkee included: NDVI (a measure of greenness) at one time, yield and quality parameters. Assessments at Nhill include: Establishment counts, NDVI at three timings, biomass cuts at flowering, yield and quality parameters.
Yield Prophet® treatment rates were determined by generating an N profit report where N applied must achieve a two-for-one return on investment from N applied at the 50 per cent probability. That is for every dollar invested in N (N cost plus application) at least $2 is returned. The Yield Prophet® treatments received different amounts of N to other treatments aside from the control which received no additional N.
Table 1. Nitrogen treatments applied to Derrimut wheat and Compass barley at Kalkee.
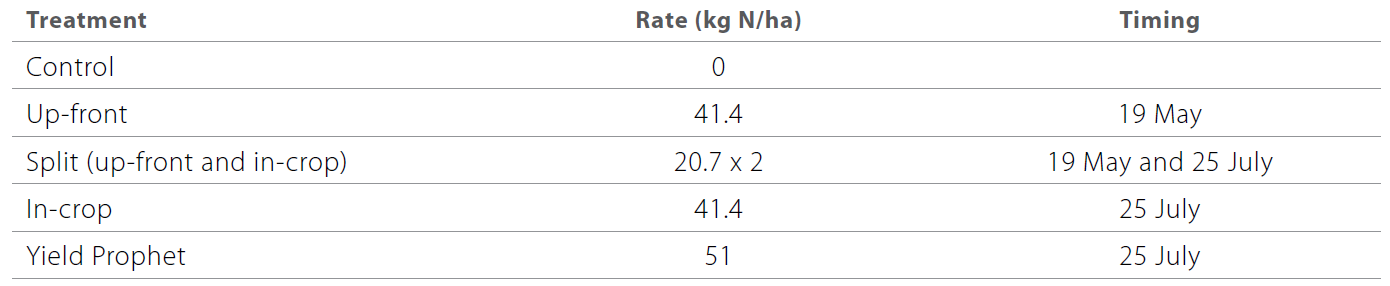
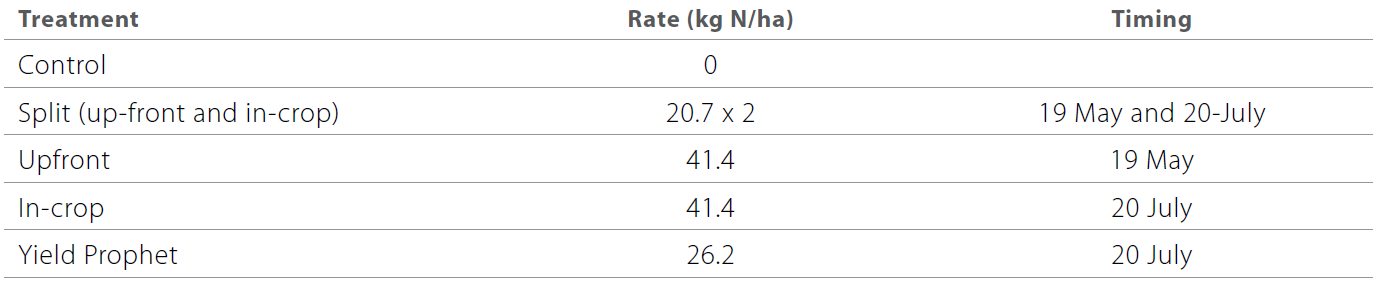
Table 2. Nitrogen treatments applied to Derrimut wheat, Compass barley and WID-052 durum wheat at Nhill.
Results and interpretation
The 2016 growing season was exceptional in the Wimmera and West Wimmera. Rainfall received was in the top ten per cent of years and temperatures were warm without being too hot. Some regions did experience significant frost. The favourable conditions meant that potential crop yields were high. Yield Prophet® was showing a wheat yield potential (nitrogen unlimited) of 4.6 and 4.2t/ha for Kalkee and Nhill respectively.
With the bulk of the rainfall received in September and October, well past the July timing of the in-crop applications, protein levels were very low.
Kalkee
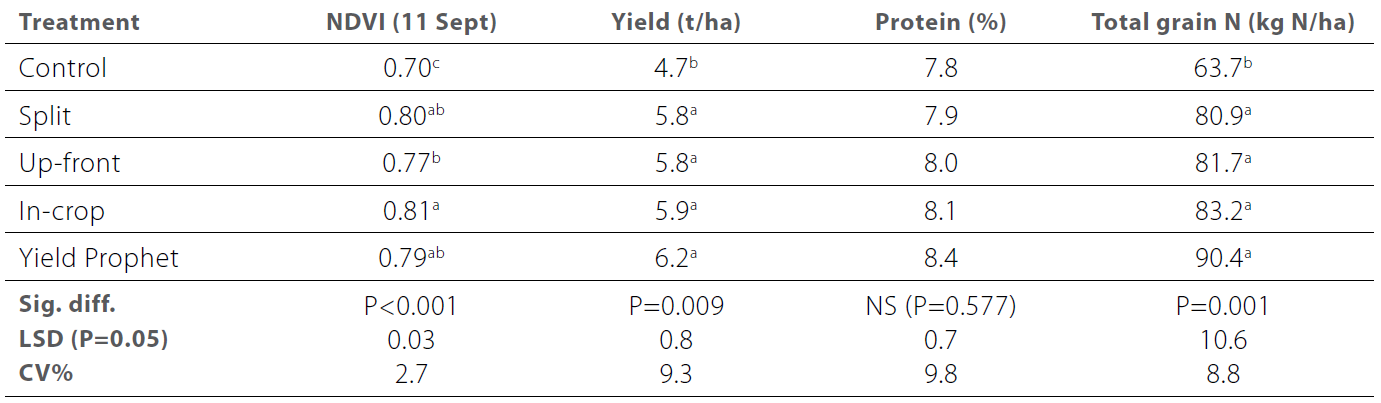
The results from the Kalkee wheat trial are largely in-line with expectations (Table 3). The NDVI conducted on 11 September at third node (GS33), 48 days after the application of fertiliser, was showing an effect of the applied nitrogen. As expected the control, with no additional nitrogen, was showing lower NDVI readings than all other treatments. In addition, the up-front treatments revealed lower greenness than the in-crop application.
The data collected from the trial is insufficient to account for this occurrence. However, a possible explanation for this is that the up-front treatment had more N during early growth. This may have resulted in more tillers and growth which effectively diluted the available N in the crops biomass, making it less green.
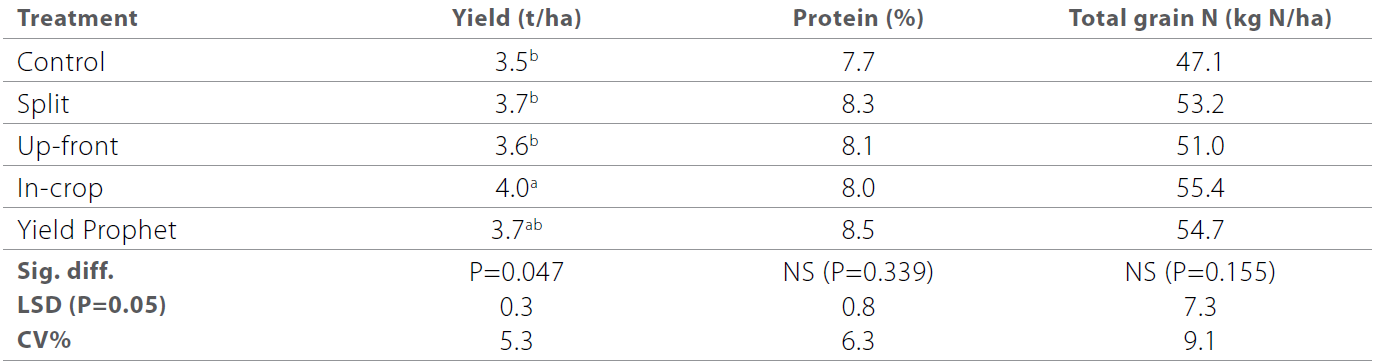
Harvest results in the wheat trial were consistent with the NDVI readings where the control exhibited significantly lower production than all other treatments (Table 3). It is worth noting that in this trial there was no effect from nitrogen timing (up-front vs split vs in-crop). This indicates that all nitrogen applied in season was available to crops with no losses. In addition, the additional N applied in the Yield Prophet® treatment compared to other treatments (16kg/ha) was not enough to exhibit a significant yield advantage.
No significant differences were observed for protein, test weight and screenings with all treatments achieving a grade of Australian Standard White (ASW1).
Table 3. NDVI, yield, protein and total grain N removed from wheat at Kalkee.
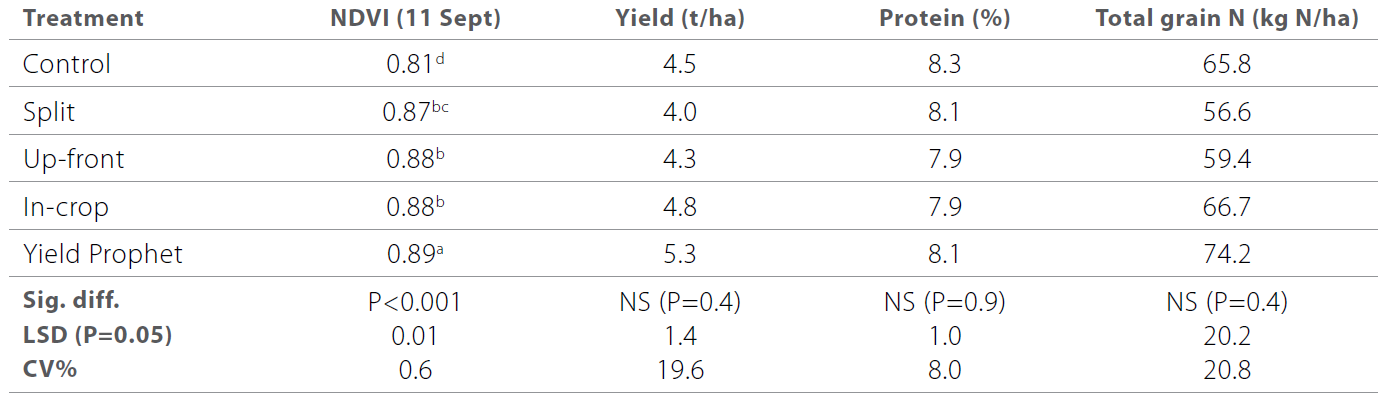
In the barley trial, only the NDVI conducted on 11 September at awn peep (GS49) revealed an effect of N applied, whereas the Yield Prophet® treatment was significantly higher than the in-crop, up-front and split treatments (Table 4). In addition, the control was lower than all other treatments.
It is evident that the extra N received in the Yield Prophet® treatment and the reduced N in the control were expressed at this relatively early stage in the season. However, this expression did not result in any yield or total grain N effects. This is counter to the results observed in the wheat trial indicating that the barley did not respond to nitrogen as well as the wheat did. There is no apparent reason for this observation. No significant effects were observed between treatments for any of the quality parameters with all achieving feed (F1) specification.
Table 4. NDVI, yield, protein and total grain N of barley at Kalkee.
Nhill
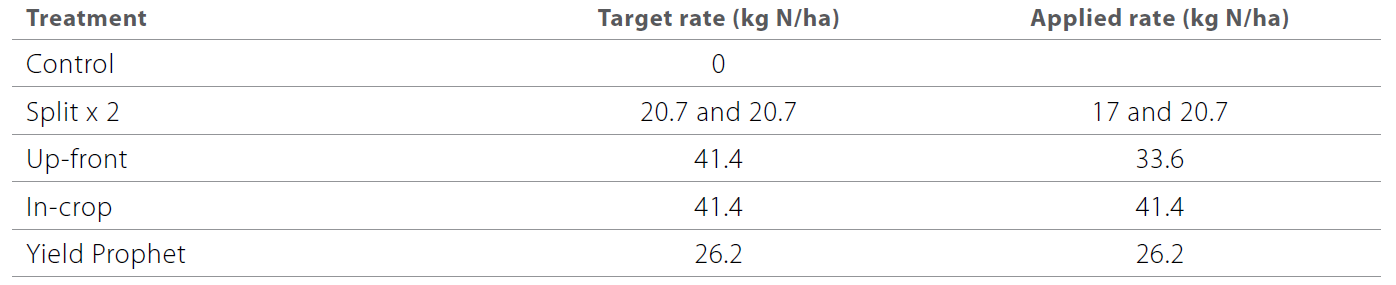
While some interesting results were observed at the Nhill trial there were some problems experienced at sowing. The sowing length of plots extended over the standard 12m. This had the effect of causing an overlap of plots and a dilution of seed and fertiliser, which in turn, would reduce the plant numbers and the amount of effective nitrogen applied under the up-front and split treatments. To address these issues the sowing length for each plot was measured, plots were cut back to remove any sowing overlap and establishment counts conducted. No remediation was enacted to overcome the differences in applied nitrogen. Table 5 shows the target amount and the average applied rate of nitrogen for each treatment.
Table 5. Treatment target and average applied rate of nitrogen at Nhill.
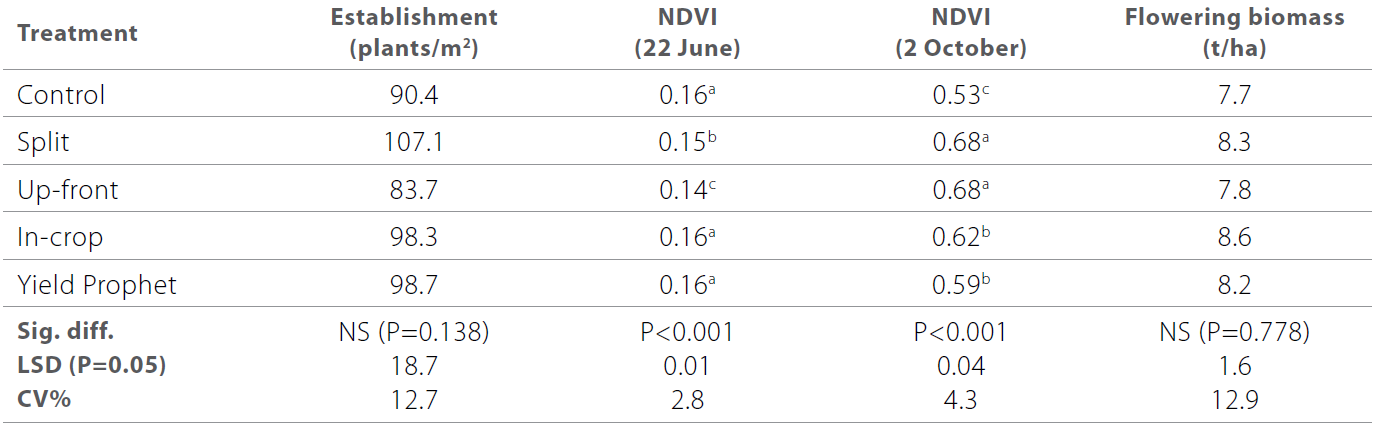
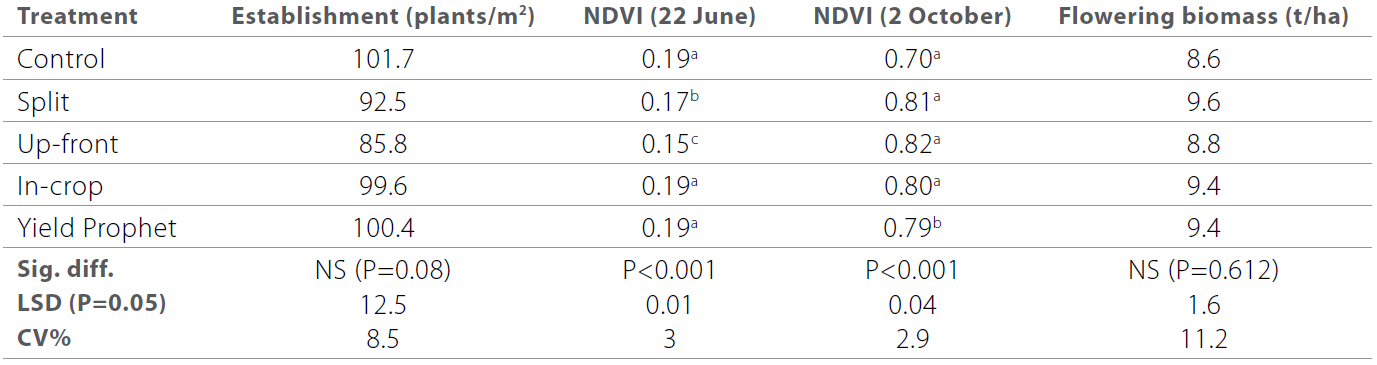
The establishment counts conducted on the wheat trial at Nhill showed visibly lower plant numbers in the up-front treatment but this observation did not translate to a significant difference in establishment (Table 6). Differences were observed in the NDVI readings in June and October but the reason for this is speculative and no data exists to explain it.
Table 6. Nhill wheat in-crop assessment results.
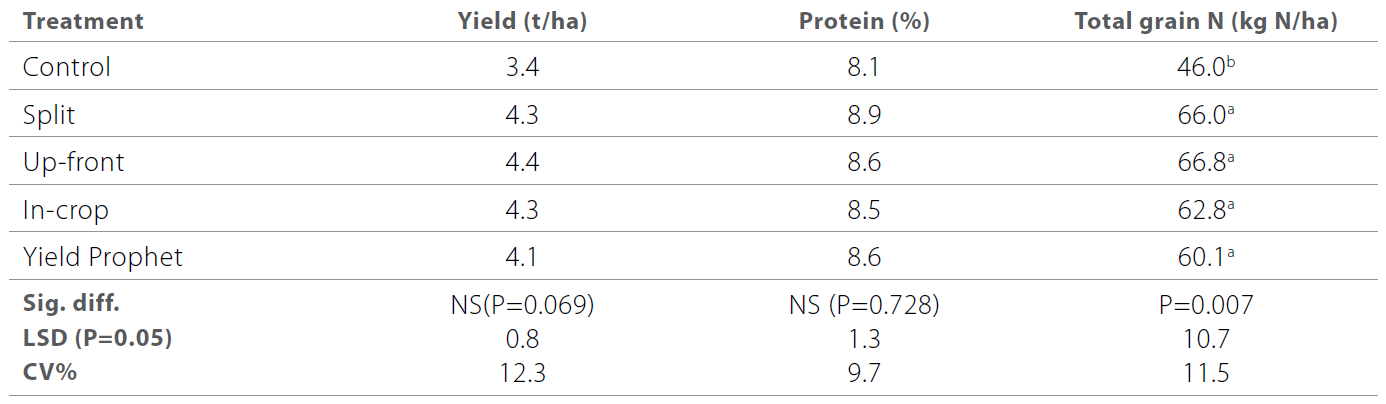
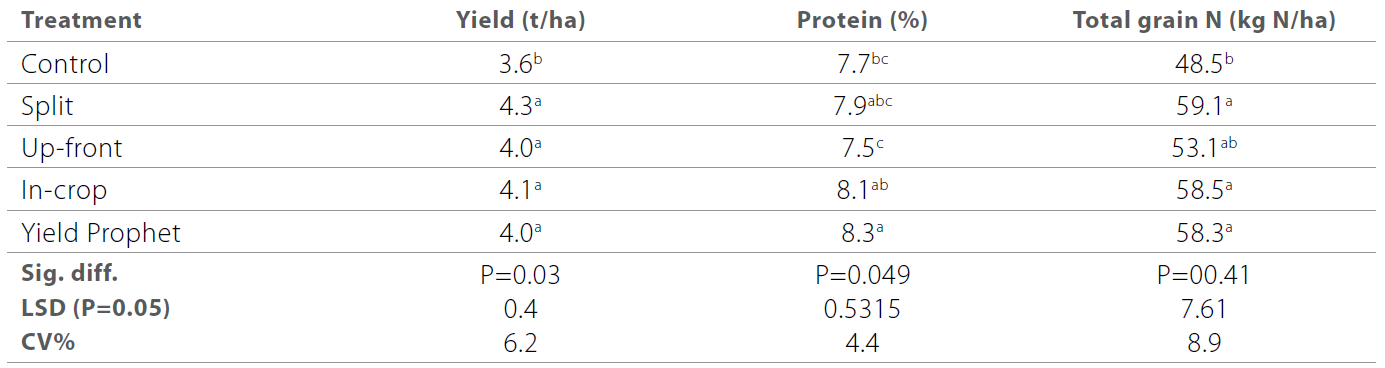
No yield or protein effects were observed in the wheat trial. Differences in the total grain N produced was observed where the control had a significantly lower total grain N compared to all other treatments. Despite the slight differences in N applied to the remaining treatments these did not translate into differences in total grain N. Similar to the Kalkee wheat trial there was no effect from nitrogen timing.
Differences were observed in the test weights with the split, up-front and in-crop treatments achieving a higher test weight than the Yield Prophet® treatment. However, all achieved above the requirement of 76kg/ha. No significant differences were observed for protein, screenings and all treatments achieved a grade of Australian Standard White (ASW1).
Table 7. Nhill wheat yield, protein and total grain N results.
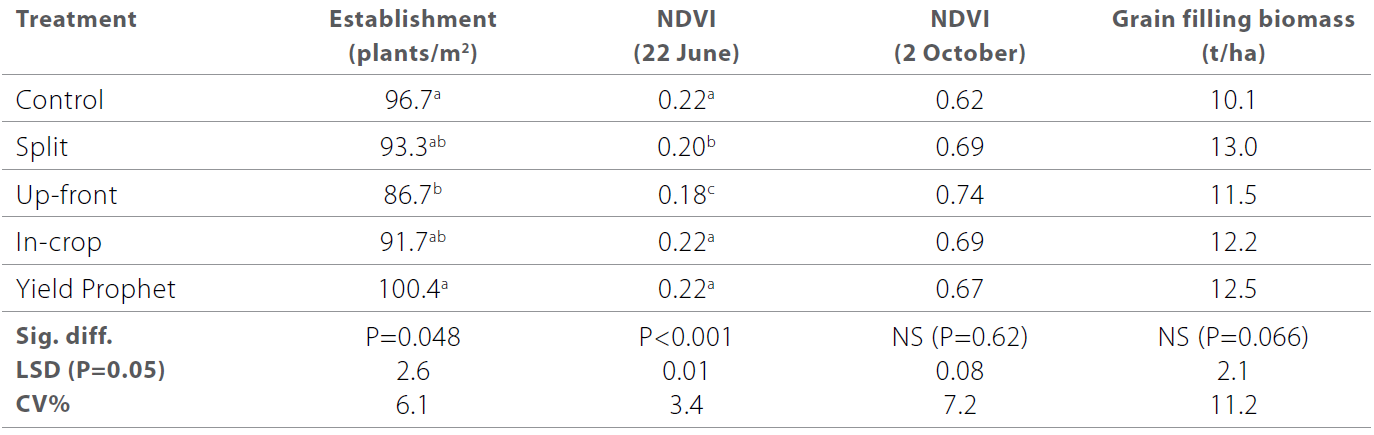
The barley trial produced differences in establishment with the up-front treatment generating a lower plant density than the control and Yield Prophet® treatments. It is clear that the higher rate of N applied with the seed in the up-front treatment resulted in seed burn. This observation carried through to the early NDVI results where the up-front treatment was less green compared to the control, in-crop and Yield Prophet treatments (Table 8). However, this was not observed in the late NDVI or biomass assessments.
Given the differences in establishment between the treatments, all of the barley trial assessments were run with the establishment counts as a co-variate. In all cases the co-variate was found to not influence the results.
Table 8. Nhill barley in-crop assessment results.
The barley trial generated higher yields in the in-crop treatment compared to the control, split and up-front treatments (Table 9). However, this did not translate to protein or total grain N. Of all the trials analysed as part of this investigation this was the only trial where the control did not produce significantly lower yield or grain N than the other treatments. There is no apparent reason for this occurrence.
Differences were observed in the screenings. The in-crop and Yield Prophet® treatments recorded higher screenings than the control and up-front treatments. However, all were well below the five per cent threshold. No significant differences were observed for protein, retention or test weight and all treatments achieved feed grade (F1).
Table 9. Nhill barley yield, protein and total grain N results.
The in-crop assessment results were similar to the results for the wheat at Nhill. There were no significant differences in establishment but there was a visual difference. This difference was picked up in the early NDVI assessment with the up-front treatment exhibiting significantly lower greenness than the split treatment which was significantly lower than all other treatments (Table 10). These observations did not carry through to the flowering biomass assessment.
Table 10. Nhill durum wheat in-crop assessment results.
The treatments applied to the durum wheat generated a response on yield from applied N; the control being significantly lower than all other treatments (Table 11). However, this pattern was not as clear when the protein and total grain N harvest results were examined. The control, along with the split, up-front and in-crop treatments, had low protein. In terms of total grain N durum in the up-front treatment was as low as that of the control. That said, the protein level for all treatments were well below the minimum protein requirement of the 10 per cent required to reach Durum three (DR3) and was deemed feed. In all the other trials no effect was observed from the alternate application time.
No significant differences were observed for test weight and screenings with all treatments achieving the thresholds necessary to reach the highest grade.
Table 11. Nhill durum wheat yield, protein and total grain N results.
Commercial practice
In most cases, the treatments that received the highest amount of N achieved the highest yield and produced the greatest amount of grain N (yield by protein).
Timing of nitrogen (up-front vs in-crop) had a negligible effect on crop yield or grain N produced for wheat, barley and durum wheat in the Kalkee and Nhill trials. Given this, and previous work conducted, using a traditional canopy management approach is recommended. (Poole and Hunt 2011).
Previous research conducted by the BCG on canopy management showed that delaying N applications until after the end of tillering can allow for a more accurate assessment of seasonal conditions to be made and money to be spent on N if a response is likely (Thompson, Reilly and Poole 2006).
Sound risk management commands that input decisions are delayed until as late as possible without affecting yield potential. If we are to minimise the risk of lost income from applications of N above crop demand, N applied during tillering should only be sufficient for the crop to reach GS30 without experiencing stress. Then follow-up applications can be considered when greater knowledge about the season and climate forecasts are available.
Over the past 20 years, cropping farmers have made notable improvements to their N management. However, with farmers experiencing increasing time pressure, and a reducing number of opportunities to effectively apply N in-crop, there is a temptation for growers to apply more N up-front. However, it is clear from these trial results that, aside from the logistical benefits, there is no advantage to yield with the added risk of seed burn from urea decreasing crop vigour and growth when fertiliser and seed are not separated well.
Nitrogen is one of the most difficult things to manage in variable climates. It is easy to apply too much or too little as evidenced by these trial results. Given this, the more information you have to guide your decision the better you will be. ‘Planning Nutrition for 2016’ (Elliot and Burke 2016), which was published in the 2015 BCG Season Research Results, provides a great summary of the best approach implement when considering crop nutrition requirements.
References
Thompson, N. Reilly, C and Poole, N. (2006) In-crop nitrogen timing and product choice for wheat, 2006 BCG Season Research Results.
Acknowledgements
This research was funded by Agritech Rural and BCG members through their membership.
