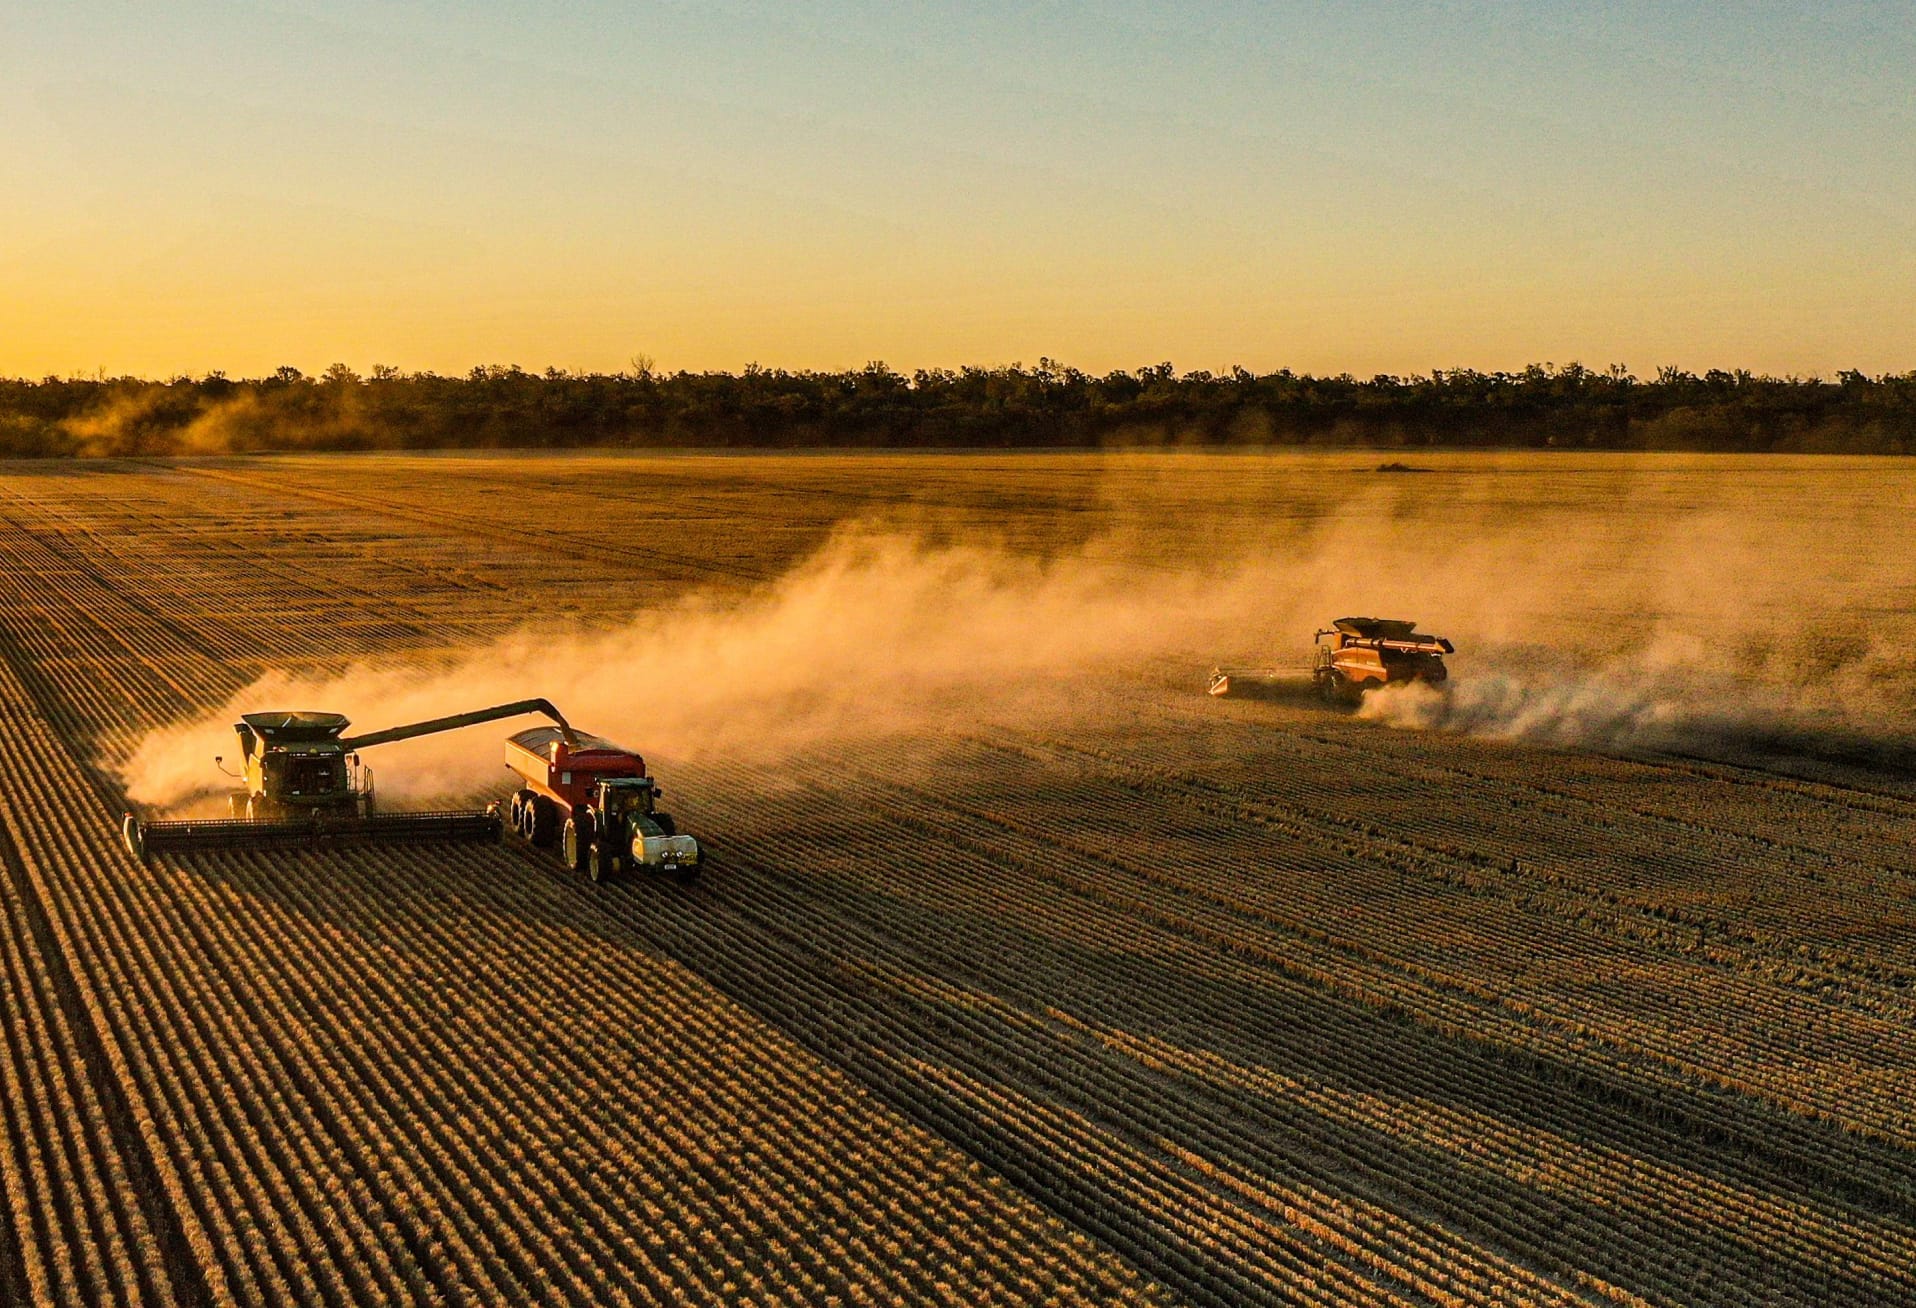
Growers are getting on board with technology for managing protein levels, with Kaniva grower and Nuffield Scholar Jonathan Dyer using a protein monitor on his header during the 2016 harvest.
Presenting at the BCG Future Farmers Expo on 5 July, Mr Dyer explained that “we are moving into the information age, where better data equals better decisions which equals more profit.”
Overlaying yield and protein map information from several years can enable growers to identify problem areas and manage them accordingly.
The motivations behind Mr Dyer’s purchase of the CropScan 3000H On Combine Analyser was to be able to monitor grain quality in real time, segregate grain in their on-farm storage, improve agronomic management and increase his understanding about the quality of grain he is producing.
Mr Dyer demonstrated that there were areas which performed above the rest in terms of quality within one paddock.
“The paddock averaged 11.2 per cent protein with an average of 4.5 tonnes per hectare (t/ha), but what I really had was 100 hectares of wheat with protein less than 11.5 per cent and 80 hectares with more than 11.5 per cent protein,” he said.
By blending these two areas of the paddock, Mr Dyer generated an extra $14,500. Instead of having 500 tonnes of ASW and only 250 tonnes of H2, resulting in a return of $147,500, he had 200 tonnes of ASW and 600 tonnes of APW with a return of $162,000.
“This works out to be a nine per cent increase in returns from just the one paddock, with no extra work,” he says.
“When we supply to the receivals you can clearly see blending occurring, but the grower isn’t getting paid any more for it, so why not blend on-farm?”
Mr Dyer reiterated that these figures are from one paddock during one exceptional season. The paddock was also very variable – a more uniform paddock would not be expected to generate the same returns.
Other factors that were considered included the upfront cost of the of the protein monitor and the market spread at the time.
With the extra information generated, Mr Dyer hopes to continue to use the monitor to improve agronomic decision making, but, this is currently limited as the data he collects from his yield monitor is not compatible with the information returned from the protein monitor.
Unfortunately, this issue is not uncommon and something that will need to be overcome before widespread adoption of this type of technology can occur.
This article was published in the Stock and Land July 27.
Below you will find Mr Dyer’s presentation from the 2017 BCG Future Farmers Expo.


