BACKGROUND
Varieties have different characteristics that can influence responses to inputs such as nitrogen(N). Aspart of the GRDC funded “Southern barley agronomy”, current and new varieties are being evaluated for responses to specific agronomic practices that occur in a no-till farming system.
Hindmarsh possesses a semi-dwarf gene which causes its erect leaf habit and slower early growth. This can reduce competition with weeds early in the season and also allows greater light penetration through the canopy as the crop grows, further favouring weed survival. One theory, particularly in the Mallee, is that Hindmarsh may require more N at sowing than other varieties to yield better. The practice is also intended to increase the vigour and subsequent competition of Hindmarsh against weeds such as ryegrass and brome grass.
This paper will investigate whether various varieties respond differently to N.
TAKE HOME MESSAGES
-
there is no significant difference in the way varieties respond to various amounts of nitrogen (N). Results indicate that for all varieties, as N increases, yield increases incrementally
- the most profitable N rate for Commander, Buloke and Hindmarsh is 80kg N/ha, whilst Gairdner was still more profitable at 120kg N/ha
AIM
To determine the nitrogen responses of new barley varieties.
METHOD
Location: Corack
Replicates: 4
Sowing date: 19 May 2011
Seeding density: 140plants/m2
Crop types: Buloke, Hindmarsh, Commander and Gairdner Barley
Herbicide:
17 May – Triflur® (1.5L/ha), Roundup PowerMax® (2L/ha), Goal® (100ml/ha)
22 July – Velocity® (670ml/ha), MCPA LVE® (350ml/ha)
Fungicide:
26 August – Prosaro® (300ml/ha), Spread Wet® (0.25%)
Fertiliser:
19 May – 50kg MAP
20 June – treatment application
Varieties: Buloke, Hindmarsh, Commander and Gairdner barley
N rates and timing: 0,20,40,80,120,160kg N/ha (3-leaf)
Seeding equipment: knife points, press wheels x 30cm row spacing
Data recorded throughout the season included establishment as well as dry matter counts at the end of tillering, flowering and maturity. Plant height, shoots and head counts were also recorded, along with “canopy greenness” using a handheld GreenSeeker at critical growth stages. Quality parameters were measured on the grain.
Gross income (yield t/ha x grain price) was determined after classifying individual plots as Malt or Feed, based on quality parameters. Cash price from AWB Birchip on 2 December, consistent with the rest of this publication, was used to establish returns. The exception was the malt Commander, which was based on the cash price at Graincorp Birchip, on the 2nd December.
An analysis of variance was used to test for significant effects of treatments and interaction between treatments at each assessment. Least significant differences were calculated at the 95% confidence rate.
Weather conditions and rainfall at Corack were measured using a Campbell Scientific Aust. ET107 automatic weather station.
RESULTS
SOIL FERTILITY
From the soil analysis taken in March, 44kg N/ha (0-100cm) was available to the crop following the previous wheat crop that yielded 2t/ha. These figures were based on both nitrate and ammonium N. There was also 111mm/ha of plant available moisture in the profile. The site received 449mm of rain from January to November. Of that, 124mm was received during the growing season (April to October). Assuming the starting N and moisture, with a yield potential of 2.5t/ha, further N would be required.
PRODUCTION RESPONSES TO N
As the soil test indicated, the site was very responsive to N. The different N treatments were applied at the 3-leaf stage (20 June) prior to a 5mm rainfall event the following day. It was not until August, when the site received over 40mm of rainfall in two separate events, that noticeable differences were observed.
Most notable was the difference between the number of heads, not only between treatments, but also in varieties (Table 1). Commander had significantly more heads (mean of all N rates) than Hindmarsh and Gairdner. The number of heads increased with the addition of N in all varieties (P<0.001) and there was a strong interaction between variety and N (P=0.008). Hindmarsh, despite having lower plant numbers at establishment, produced an equal number of heads as Commander at the higher N rates. This difference was not found in Gairdner, which had the lowest head numbers at all N rates. At the highest N rate, Gairdner (369heads/m2) produced fewer heads compared with Buloke (584 heads/m2), Hindmarsh (608 heads/m2) and Commander (649 heads/m2),(P=0.008, LSD 97, c.v.15%).
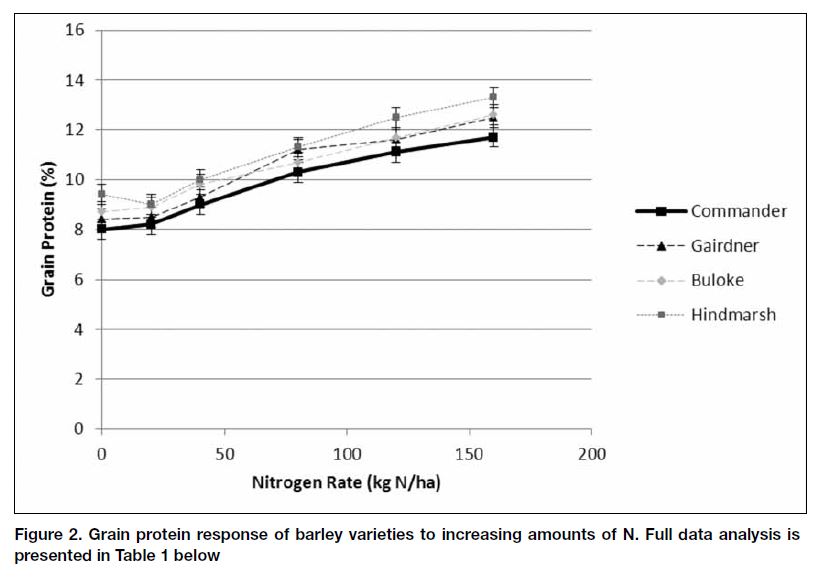
In terms of grain yield, there was no evidence to indicate that the varieties differed in their response to N, each variety reacting in a similar manner to increasing amounts of N (Figure 1). Commander was the highest-yielding when greater than 80kg N/ha was applied (variety P<0.001).
As expected, grain protein increased incrementally with the rate of N (P<0.001). Varieties did differ in their protein levels, which is consistent with other trials. Commander had lower protein compared with the other varieties, although this can be partially explained by a dilution from its higher yield. In other trials, Commander has been found to have inherently lower proteins, which may indicate that the lower protein of Commander in this trial is not simply the result of dilution. There was no interaction in protein between variety and N rate, which again reinforces the conclusion that the varieties respond similarly to applied N. Retention was exceptional at all rates, with all varieties achieving greater than 95%. There was no difference between treatments in test weight (>65kg/hc) and screenings (<5%).

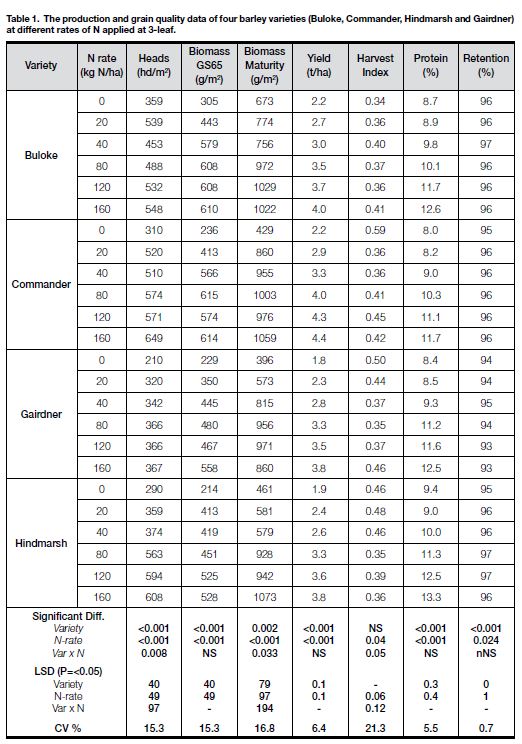
Biomass differences at anthesis (GS65) and maturity (GS99) were measured. Buloke and Commanderproduced more biomass at 40 and 80kg N rates, but it was not significant at 0, 20, 120 and 160kg N rates. At maturity, those differences were less pronounced. Biomass at both stages for each variety increased with additional N. The differences in biomass were supported by changes in the NDVI measured by the handheld GreenSeeker. The NDVI had a strong relationship with increasing the N rate for each variety. However, this reinforced that comparisons between varieties should be avoided due to the differences in their physical nature (Figure 3 and 4). Figure 3, below, illustrates how Hindmarsh, due to its erect nature, has a lower NDVI reading compared with the other varieties (mean of three varieties). Also evident in Figure 3, is the difference between the two sites (Culgoa and Corack) and seasons. The Culgoa site in 2010 had a higher amount of available soil N (68kg N/ha) than the Corack site in 2011 (44kg/ha) down to 100cm. Similar findings have been found in other studies (Poole, N, BCG 2010 Season Research Results pg 97).

As previously mentioned, linkages of NDVI to biomass and yield are strongly influenced by the structure of the crop type or variety. It is also influenced by the chlorphyll content of the plant. Figure 4 illustrates that the anthesis (GS65) biomass, represented by the bars, plateaus at the higher rates of N, whereas the NDVI continues to rise incrementally. In terms of biomass, the plateaus begins to occur between 40-80kg N/ha, but the NDVI does not plateau until at least 120kg N/ha. The NDVI also showed little difference between Gairdner, Buloke and Commander, but the actual biomass values would suggest otherwise. For example, at 40kg N/ha, there was no difference observed between Gairdner and Buloke in the NDVI, despite there clearly being biomass differences. The prostrate nature of Gairdner compared with the semi-erect Buloke means that there is less bare ground reflectance; hence a higher NDVI is produced.

Based on the biomass at maturity, a theoretical harvest index was calculated. Harvest index is simply a ratio of the amount of grain to biomass. In average seasons, the harvest index is typically 0.3-0.4, whilst in drier seasons the harvest index can be closer to 0.5. In this season, the varieties did not differ in harvest index. The harvest index decreased with additional N rate, as would be expected with higher biomass accumulation, and there was a significant interaction between variety and N rate.
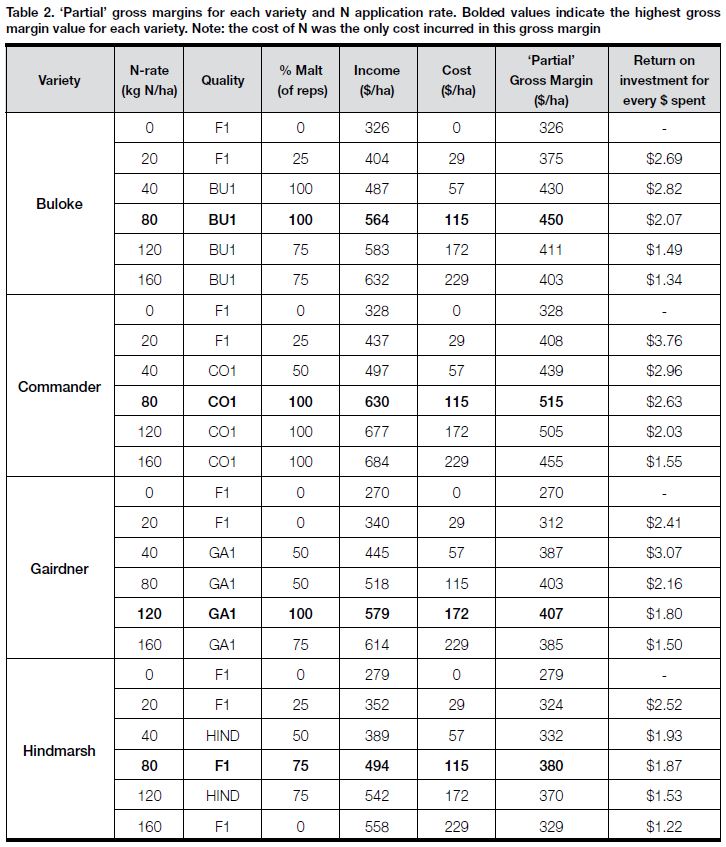
Economic comparison between varieties showed the gross margin of each variety at the different rates of N (Table 2). The most profitable rate was 80kg N/ha for Commander, Buloke and Hindmarsh. Commander’s higher yield meant that it was the most profitable, with $515/ha at the 80kgN/ha. The most profitable rate of Gairdner occurred at 120kg N. This analysis demonstrates that N was needed to be applied at the site, and for every dollar spent, there was on average a $1.3 return on investment. Higher returns on investment were found at lower N rates.
COMMERCIAL PRACTICE
The findings of this trial are that the new barley varieties respond in exactly the same way as the current varieties. This certainly takes some complexity out of nitrogen decisions in barley. The value of N in 2011 would have been known prior to sowing, if the soil N levels and available moisture were determined. This is where soil testing can be helpful to determine when further N is required.
ACKNOWLEDGMENTS
The project was funded by the GRDC (project code: DAN00138).
REFERENCES
Poole, N and Craig, S, ‘Use of crop sensors for determining N application during stem elongation in wheat,’ BCG 2010 Season Research Results, pp 97-108.
