Take home messages
- once you have decided on how much crop to put in, the greatest impacts on your bottom line will come from how you managed the crop and what it cost you
- making in-crop decisions on inputs has to be done in context of the likely yield
- Yield Prophet® will help you make better decisions
Background
Over the last fifteen years, cropping farmers have made improvements in the agronomic management of their crops, such as:
- canopy management is widely practised: crop nitrogen (N) requirements are rarely applied up-front
- herbicide technology is much better understood: spraying is now carried out with reduced drift; herbicide resistance is better managed
- diseases are under control: the three rusts are not as unmanageable as first feared.
The most important agronomic challenge remaining is to manage inputs by linking yield potential to seasonal forecasts.
What do we need to do to reach our ultimate goal of being able to better manage the risk of production in cropping? Farming will remain a high risk venture, with natural climate variability throwing a spanner in the works in the form of extreme events such as frost, heat, drought, excess water, etc. Climate change is likely to make this scenario even more extreme. We now know more about growing crops and risk management than ever before. Yield prophet is the tool of choice to help manage production risk.
Aim
To demonstrate how Yield Prophet can be used to optimise production with reduced risk.
Method Yitpi wheat was sown at the Corack Main Research Site on two separate dates: 19 May and three weeks later on 9 June. The site was set up to enable Yield Prophet to be run, with soil water and available nitrogen measured pre-sowing. Rainfall was measured from the Corack site. BoM forecasts – short and long term – were closely watched during the season and decisions on further in-crop nitrogen fertiliser applications were based on the likelihood of rain. The season was ‘played’ according to the best information available.
Location: Corack
Replicates: demonstration only
Sowing date: 19 May 2011 and 9 June 2011
Seeding density: 150 plants/m²
Crop type: Yitpi wheat
Seeding equipment: Gason parallelogram, knife point, press wheel (30cm spacings).
Table 1. Treatments for the crop risk demonstration

Decisions made as the season developed
Pre-sowing
At sowing, the site had 114mm of Plant Available Water in the profile: the bucket was almost full, setting the crop up with high potential. Soil available nitrogen was low at only 44kgN/ha. To fulfil the yield potential based on a soil profile full of water, we knew that N fertiliser would need to be applied to the crop.
Sowing
In mid-May, 16 mm of rain fell, adequate for a good germination of the early and later sown crops. All treatments were sown with MAP (at 5kg N/ha).
Early July
The site was very low in topsoil N (only 10kg N/ha): it was necessary to apply nitrogen early to ensure appropriate tillering. The first application of top-dressed nitrogen, at 46 kg N/ha, was applied at GS14 (4leaf stage) to the moderate and high input treatments only. The eight-day forecasts from BoM were used to target a topdressing application which coincided with a follow-up rain.
Late July into early August
By late July, the early sown crop was at GS16 (6-leaf) and by early August the later-sown crop was at the same stage. Even though the season was relatively dry, with only decile 1 rainfall up to that stage, the crop was growing well and accessing stored soil water. A Yield Prophet report at that time showed that both the early and late sown crops would benefit from another application of N fertiliser (50% chance of a 1.4t/ha benefit from topdressing). The longer term climate forecasts, such as POAMA, were indicating the likelihood of slightly below average rainfall in September and October. Based on this forecast and because the soil still had plenty of water available to the crop (Plant Available Water at this stage during the season was 80mm), the high input treatment was top-dressed with another 46 kg N/ha .
Results
Growing Season
Rainfall GSR was low throughout the season and the season ended on a decile 1 to 2, with only 153mm falling during the growing season (April 1 2011 to October 31 2011).
Nitrogen response
The crop without extra applied N was poor throughout the season, the crop with one application looked better and the crop with two applications looked the best. Yield Prophet reports showed that the crop without any applied N was stressed for most of the season. The crop with one application started to be stressed for N during August. The crop with two applications started to run low on N later in the year and also experienced some N stress.
Frost and heat shock events in 2011
The first time of sowing crop reached mid flowering (GS65) on 29 September, whilst the second time of sowing crop was flowering on 13 October.
The second time of sowing crop experienced a mild frost (0 – 2°C) during flowering. It is not expected that a frost of such low severity would have caused damage.
The first time of sowing crop experienced two days of a mild heat shock event (32 – 34°C) during grainfilling, whereas the second time of sowing crop experienced two days of a mild heat shock event and one day of a moderate event (34 – 36°C). The second time of sowing crop may have been damaged during the more severe heat shock events and experienced reduced grain-filling capacity. The extent of frost and heat shock damage caused during flowering and grain-filling is being quantified in another BCG research program.
Yield
The simulated yield of the high N rate plots was very similar to the harvest yield (TOS1: 3.0 and 3.3t/ha; and TOS2: 2.6 and 2.8t/ha respectively for simulated and harvest yield achieved) (Table 2). The harvest yield achieved for the plots with no applied N was higher than the simulated yield, indicating that more N was available than was initially thought. Yitpi sown in the middle of May had a higher yield compared with Yitpi sown three weeks later in early June.
Table 2. Yield Prophet simulated yield, harvest yield and protein achieved

Based on the classification achieved according to grain protein and screenings, the margin was calculated for each treatment (the cost of the fertiliser applied was subtracted from the gross return). The first time of sowing with moderate N input had the highest return. For the second time of sowing, the high N input treatment had a slightly higher returns ($38/ha) compared with the moderate N input because protein was low for the moderate treatment and the grain produced made only ASW1 classification (not APW1 as for the high N input treatment) (Figure 1).
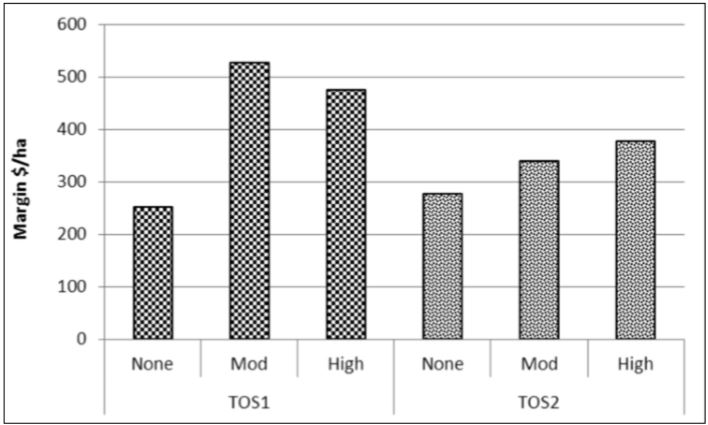
Figure 1. Margin return (income based on gross return – cost of N fertiliser)
Interpretation
Harvest yield achieved was close to the simulated yield at the high fertiliser N input rate and was very similar for the moderate N input rates. For the moderate input the simulated yield was lower than the actual yield achieved, probably due to an underestimate of the amount of available soil N as measured prior to sowing.
Commercial practice: what this means for the farmer
Yield Prophet is useful in many ways such as determining the optimum sowing time for different wheat varieties; assessing risk of frost or heat stress during flowering and grain filling; following the growth stages of the crop so that critically-timed crop inspections can be carried out (such as at GS39, flag leaf, for fungicide application) and managing pre and in-crop N application.
Used in conjunction with short and seasonal weather forecasts, Yield Prophet is an excellent tool for managing production risk.
Acknowledgments
The project is supported by funding from the Australian Government under its Climate Change Research Program and the GRDC.
