Take home messages
- Lentils were better at establishing and reaching target plant densities than canola.
- Canola was considerably more responsive to converting increasing sowing densities into yield than lentils.
- Seeder type had no consistent effect on establishment and yield.
- The differences in yield response to plant numbers suggests that it is more critical to get it right in canola than lentils.
Background
Crop establishment is a key foundation to vigorous and high yielding crops that are competitive against weeds. The initial few weeks of a crop’s life cycle are crucial to yield as this is when the seedling sets itself up for the season ahead. There is little information available on plant stand uniformity and levels of establishment in major winter crops, or the potential for improvement in crop establishment with current equipment. If every sown seed was established there could be significant seed savings to be made. Factors which can cause poor establishment, broadly include seeder set up, seed quality, environmental factors, seed soil contact, weather around sowing and stubble residues.
There is increasing interest in Australia and oversees in adopting precision planting technology in winter crop production. Precision planters are designed to place single seeds at a consistent distance along the seeding row and at a precise and uniform depth, meaning every plant has its own bit of ‘space’ and is less likely to compete with its neighbour (Gutsche, 2015). This in turn could help offset the cost of seed.
Precision planters are used widely in summer crop production, such as sorghum, corn and cotton, where seed costs are high. In cotton and summer cropping this results in more uniform plant stands compared to conventional seeders by having more even inter-plant spacing. There is some evidence from earlier studies that this may improve yields and allow reductions in required plant populations and therefore seed costs (Murray, 2006).
Aims
- To evaluate the performance of commercial seeders in establishing canola and lentils by conducting a survey of paddocks.
- To determine the effect of sowing density, row spacing and seeder type on plant establishment in canola and lentils and subsequent grain yield.
Paddock details
| Location: | Narraport |
| Plant available water: | 66mm (at 3 April 2018) |
| Crop year rainfall (Nov-Oct): | 200mm |
| GSR (Apr-Oct): | 138mm |
| Soil type: | Clay loam |
| Paddock history: | Fallow 2017 |
Trial details
| Crop type/s: | 44Y89 canola, PBA Hurricane XT lentils |
| Treatments: | Refer to Table 1 |
| Target plant density: | Refer to Table 1 |
| Seeding equipment: | Refer to Table 1 |
| Sowing date: | 16 May 2018 |
| Replicates: | Four |
| Harvest date: | 12 November 2018 |
| Trial average yield: | 0.9t/ha canola, 0.4t/ha lentils |
Trial inputs
| Fertiliser: | 16 May: Granulock® Supreme Z + flutriafol @ 60kg/ha 4 July: 100kg/ha urea (canola only) |
| Herbicide: | 16 May: Propizamide @ 800g/ha + Lorsban® @ 1L/ha + Roundup 1.5L/ha canola and lentils |
| Pests, weeds and disease managed according to best practice in-season. | |
Method
1. Paddock survey of seeders and establishment
In 2018 a survey of 140 paddocks over the GRDC Southern and Western regions was carried out by farming systems groups in South Australia, Western Australia and Victoria. The survey measured seedling numbers at five random locations within each paddock, interplant distance (for 3m of crop row), seeding depth, seedbed moisture content and stubble cover. In the Southern region crops included canola, lentils and faba beans while in the Western region lupin, canola and wheat paddocks were the focus. Surface soil samples and rainfall totals around sowing were also collected. A questionnaire was distributed to the growers to gather information on seeding equipment, cropping history and management of the surveyed paddocks.
2. Small plot trial
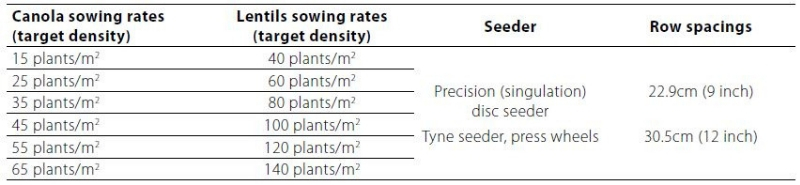
Two replicated field trials (canola and lentils) were sown using a split plot design, with a tyne seeder and precision planter and two row spacings, 22.5cm (9 inch) and 30.5cm (12 inch). Six sowing rates were used for each crop type to look at establishing target densities as outlined in Table 1.
Fertiliser for the trial was broadcast over the trial area prior to sowing and then incorporated by sowing as the precision plot seeder was not fitted with a fertiliser distribution system. Sowing densities were adjusted to account for the canola seed germination of 90 per cent (%) and lentils of 98%, and field establishment was estimated.
Assessments included establishment counts five days apart following the first sign of emergence. Interplant spacings were measured once the canola and lentils had fully established by measuring the distance between 30 adjacent seedlings in two crop rows. A drone was used to capture the normalised different vegetative index (NDVI) for each plot to measure color differentials between treatments. Crop biomass at flowering, harvest index and grain yield were measured, and grain quality was assessed.
Table 1. Sowing rates (target density) for lentils and canola, seeder type and row spacings used.
Results and interpretation
1. Paddock survey of seeders and establishment
Of the growers who participated in the 140-paddock survey, the return rate of the machinery and paddock questionnaire was 58%. Some key results from the paddock survey and the questionnaire were:
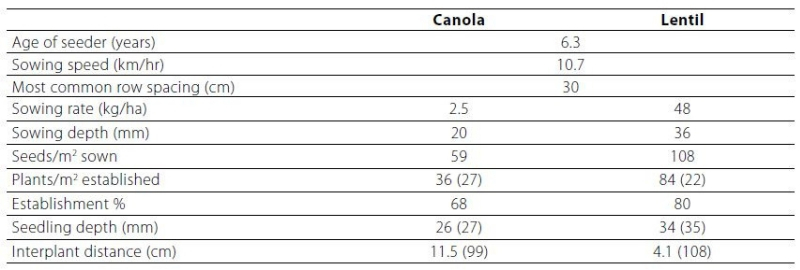
- The equipment used to sow crops varied greatly in age and manufacturer. Age of seeders ranged from <1 year to 30 years, with most seeders being 6-10 years old (Table 2). Crops were sown with machines from 19 different manufacturers, with the three most commonly-used makers (John Deere, Bourgault and Flexicoil) accounting for just under half of the equipment.
- Almost all growers (94%) calibrated their seeders before sowing, with 55% using a manual
calibration and 39% using the control system. - 70% of growers adjusted sowing rates for seed weight and 40% adjusted for germination
percentage. Most growers were satisfied with the seed placement of their seeder with 53% rating it as ‘Good’ and 17% as ‘Excellent’. Average crop establishment (i.e. plants/m2 as a percentage of the seeds/m2 sown) ranged from 59% in lupin to 97% in faba bean, with establishment rates of the remaining crops being around 70%. - Seed placement was variable both within and between paddocks. Among all the paddocks
surveyed 55% of the seed was within ± 1 cm of the indicative sowing depth and 82% was within ± 2cm of the indicative sowing depth. In relative terms, 61% were within ± 50% of the indicated depth of sowing. There was little difference in average establishment and variability in plant stands among the three most common types of seeders – John Deere, Bourgault and Flexicoil. - The survey included two growers who used precision planters. These paddocks had lower plant populations as they aimed for lower sowing rates. These crops tended to have less variable plant numbers and seed placement, but they were not always the least variable. A small proportion of paddocks sown with conventional air seeders showed similar or less variation.
- Seedling establishment and uniformity were positively correlated with rainfall and soil moisture around sowing in faba bean and canola. In contrast, for lentils only, high rainfall around sowing was significantly correlated with lower establishment and greater variability in plant numbers.
Table 2. Mean results from the paddocks surveyed in North West Victoria by BCG in 2018. The values in parentheses are the coefficients of variation (%) for the data.
2. Small plot trial
Sowing occurred 13 days after the site received 16mm of rain. As a result, it was largely sown into a dry seed bed, further rain was not received until 13 days following sowing. Due to the dry period, initial numbers in all plots of canola were quite low (Figure 1). However, after 19 days, at the second establishment count, canola numbers began to increase and at 27 days after sowing (DAS) they were considerably higher. All six sowing densities failed to achieve their targeted plant numbers which can be attributed to the dry start to the season. Seeder had no effect on canola plant establishment (P=0.113) however row spacing, and density had an effect on canola establishment (P=0.036) meaning that higher densities were better at the narrow row spacing than the wide row spacing. Narrow row spacing (22.9cm) resulted in an extra 2 plants/m2 being established compared to the wider row spacing of 30.5cm.
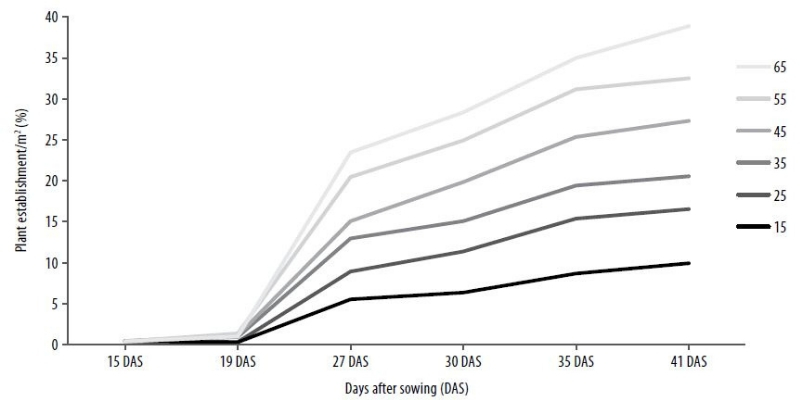
Figure 1. Average canola establishment counts. Density: P<0.001, LSD=3.5, CV=20.6%; Density x row spacing: P<0.036, LSD=5, CV=19.9%, Seeder: NS (legend denotes targeted plant density).
Lentil plots, 15 days after sowing had only established 50% of their target density, however by 41 days after sowing, all treatments had reached their target density, suggesting that establishment of lentils is likely to occur over a longer period and is more forgiving of seed placement than canola (Figure 2). Seeder and row spacing had no effect on lentil plant establishment. There were also no interactions with seeder, row spacing and density in plant establishment meaning that each one did not have a bearing on the other one.
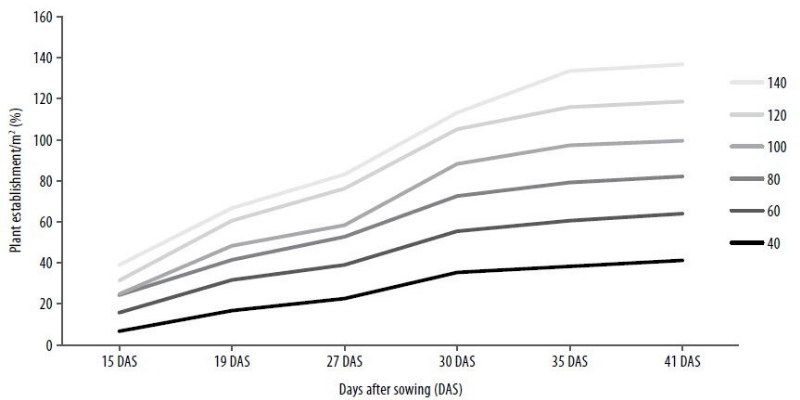
Figure 2. Average lentil establishment counts over time. Density: P<0.001, LSD=10.2, CV=16%, Seeder: NS (0.098), seeder x row spacing: P=0.033. (Legend denotes targeted plant density).
Interplant distances
Average targeted interplant distances for canola and lentils at 22.9cm and 30.5cm row spacing, based on sowing rates are shown in Table 3. Interplant distance is not something that growers can manage with conventional seeders, but it gives an indication as to the approximate distance under perfect placement that would occur between seeds at different sowing rates. This potentially comes into play with crop types which have expensive seed sources as getting the spacings near the target can reduce interplant competition.
Table 3. Average targeted interplant distances (cm) for canola and lentils based on targeted sowing rates.
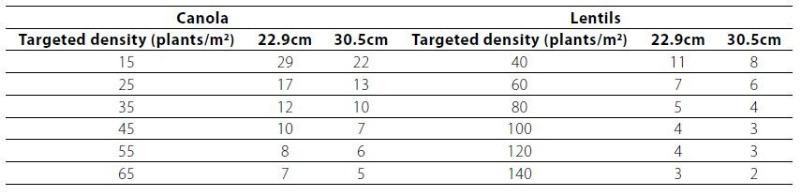
Results showed higher sowing densities had significantly lower interplant distances (P<0.001), which would be expected with more seeds being placed in the same length of row (data not presented). In a perfect world, they would all be the same distance apart so that individual plants are not competing. Row spacing had a significant effect (only slightly) with the narrow spacing (22.9) having a greater interplant distance of 3.8cm than the wider row spacing. This would be expected because wider row spacings place seeds closer together compared to a narrow row spacing for a given sowing rate.
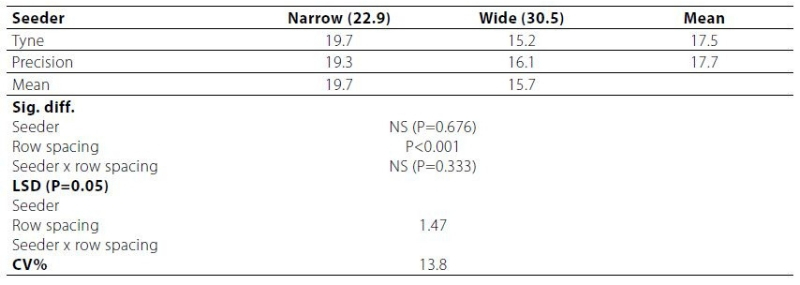
While interplant distance is not necessarily something we can manage with conventional seeders, the data can give an indication as to how much variation there was between plant spacing. Seeder had no effect on interplant distance in 2018 (Table 4).
Table 4. Canola average interplant distance (cm) for two row spacings, two seeders and six densities.
Like canola, the lentils showed that as sowing density increases, interplant distance decreases, as would be expected. Row spacing had a significant effect with the narrow spacing (22.9cm) having a greater interplant distance of 6cm, than the wider row spacings (Table 5). The precision seeder had a slightly smaller interplant distance than the tyne seeder.
Table 5. Lentil average interplant distance (cm) for two row spacings and two seeders.

Biomass and grain yield
Canola: Initial growth assessed as NDVI, was significantly greater in canola sown with the tyne seeder (P<0.001). The difference was relatively small and diminished over time. By flowering there was no difference in biomass between the two types of seeders. It is unknown what effect the pre-emergent herbicide may have had on the initial growth of canola as it is generally recommended not to use propyzamide in a disc seeding system. Biomass at flowering was significantly greater in wide rows (3.5t/ha) compared to the narrow rows (3.1t/ha) (P=0.015) but it was not affected by plant density or by seeder type.
The only factor that significantly impacted grain yield of canola was plant density. There was a strong response to increasing plant number. Grain yield increased from 0.65t/ha to 1.05t/ha when established plant density increased from 15 plants/m2 to 45 plants/m2 (Figure 3).
There was no significant difference in the response to plant density between the two seeder types. At the lower sowing densities, yield was penalised by poor establishment as many did not reach their intended establishment. The targeted density of 65 plants/m2 reached a rate of 37 plants/m2 which would be considered a standard canola density. Given the dry start and seasonal conditions, the lower densities did not have time to compensate.
Lentils: Seedling growth in June and early July was slightly but significantly greater in lentils
sown with the tyne seeder (P<0.001), but by 25 July there was no significant difference in biomass production between the two seeders. At the start of flowering, biomass was not affected by seeder type and was influenced by plant density, with biomass increasing as plant density increased. The only factor that had a significant effect on grain yield was plant density, but in contrast to canola, the response was small. Grain yield did not increase significantly above about 60 plants/m2 (Figure 3). Therefore, apart from the lowest sowing rate, lentils were able to use the resources equally over a range of plant densities. The 2018 seasonal conditions may have had a part to play in yield, however these effects are not truly known.
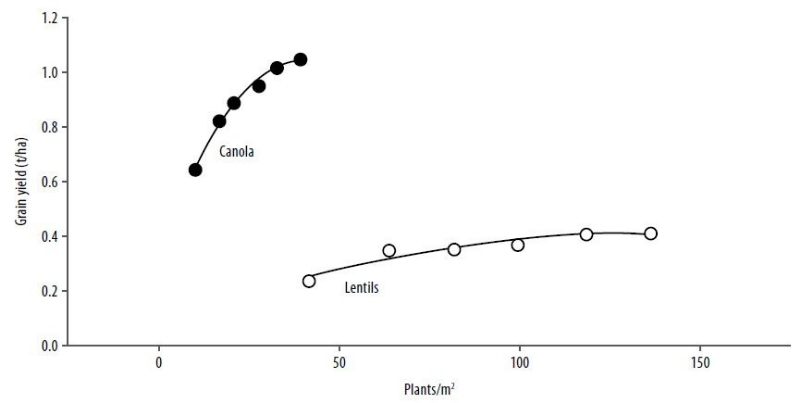
Figure 3. Grain yield responses to the actual number of plants established in canola and lentils. Density: Canola yield P<0.001, lentils P<0.001.
South Australian experience
In an identical set of trials in the mid north of SA, in 2018 which received 288mm of annual rain, a yield advantage from the precision seeder was observed in both canola and lentils. Grain yields in canola ranged from 1.2-1.7t/ha across the trial. The benefit of the precision seeder was only observed under narrow row spacing averaging 1.6t/ha. This is in comparison to the remaining seeder and row spacing combinations which averaged less at 1.3t/ha. It is still unclear why the increased yield was only observed under one row spacing and requires further investigation.
The variability in the lentil grain yield data was much higher compared to the canola (CV=15% versus 8% for canola). Seeder type and plant density were the most important factors effecting grain yields which ranged from 1.1-1.6t/ha. On average the precision seeder yielded 1.4t/ha compared to the conventional seeder at 1.2t/ha. This was a gain of 0.2t/ha in lentil grain yield from seed singulation.
Interestingly, grain yield increased at lower plant densities in both seeders. The optimum plant populations for most lentil varieties is 100-120 plants/m2. In the Hart Field Site trial, Hurricane lentil yields were maintained and, in some instances, improved at plant densities of 40-80 plants/m2. It should be noted however, that these trials are managed under low weed and disease pressure.

Figure 4. Grain yield responses to the actual established plants in canola (top) and lentils (bottom). Grain yield canola: seeder x row spacing P<0.001, lentils: seeder P<0.029, density P<0.012).
Commercial practice
Results have indicated that precision seeding compared with tyne and press wheel with dry sowing lentils and canola did not improve establishment or yield in 2018. Seeder influenced interplant spacings in lentil but not in canola. The difference was not enough in this year with below average rainfall year to achieve a difference in canola or lentil yields. This is worth investigating further in a wider range of sowing conditions and seasonal conditions.
If the interplant distance and density can be improved in a friable moist seeding bed it will be
interesting to assess the difference in seeding systems in a different rainfall season, that was not explored in this trial.
The plot trials highlighted the importance of plant density to yield, especially in canola. Yield
differences in both canola and lentils were mainly attributed to sowing density. Optimum sowing density achieved in lentils was 60 plants/m2 and 32 plants/m2 in canola (although targeted 55 plants/m2) in a dry season. These results highlight the importance of continuing this work in future seasons. One year of data is not conclusive to recommend changing sowing densities.
The results from the paddock survey highlight the importance of adjusting sowing rates based on germination percentage. Out of the 140 paddocks surveyed in the Western and Southern regions, only 40% adjust for germination percentage, this is an area where potential profit can be made.
Steps to achieve successful establishment:
- record your target sowing density, this will give you something to go back and measure
after sowing - know your seed source – check germination and seed size so that you can adjust sowing rates to account for good or poor-quality seed and large or small seed
- calibrate your machine – take time for each crop type/variety to adjust your sowing rate to suit the crop type and the seed source (germination)
- do as much as you can to control seeding depth so that it is kept as uniform as possible
- check effectiveness of sowing – don’t assume it went well because the seed is in the ground, look at the result, and look for opportunities to improve if the result is not what you expected
- consider the soil moisture conditions at the time of sowing and adjust seeding rate accordingly using predicted field establishment rates based on previous experience.
The results presented were from year one of a three-year project which was a below average rainfall season and are not conclusive enough to make changes commercially on-farm in 2019. However, they do highlight the importance and need for further research in lieu of the significant grower’s investment in machinery and seed.
On-farm profitability
Machinery investment is a significant capital cost for any farm business, therefore replacing a seeder needs to be done with care consideration. One precision planter unit/tyne assembly costs $3,000. If considering a precision seeder, additional costs include a true steer on the seeding bar are required to make it work well.
The results from 2018 show that there was no benefit in seeder type in final grain yield. It is
currently unknown what level of yield advantage we need to see in winter cropping to justify
the additional cost.
Other factors such as weed competition, and airflow for disease that are very hard to measure financially but would have impact on long term financials.
References
Gutsche, C. (2015) Evaluating the power of precision. SANTFA newsletter Autumn 2015.
Acknowledgements
This research was funded by the GRDC as part of the ‘Optimising plant establishment, density and spacings to maximise crop yield and profit in the southern and western regions’ project (9176134), in collaboration with University of Adelaide.
