Break crops have been shown to provide benefits to subsequent wheat yields in grain growing regions outside the Mallee. The area sown to broadleaf break crops in the Mallee declined dramatically in response to the Millennium Drought. This was a rational management response, given the high risk and poor profitability of many break crops in drought years. However, following a wet 2010/2011 summer, many farmers took the opportunity to include a break crop in their rotation by sowing canola.
A series of trials by BCG has evaluated a range of break crops for their impact on subsequent wheat yields and long-term gross margins. In 2011, wheat yields were increased following legumes (peas and vetch) relative to fallow, canola and wheat (see BCG 2011 Season Research Results pp. 27).
Take Home Messages
• Wheat yields in 2012 were higher following hay, brown manure or fallow in 2011, probably due to extra water conserved in these treatments.
• Crop sequences including a break crop are at least as profitable as continuous wheat, with some examples of substantial profit gain.
• Where continuous cereals are grown, cutting wheat for hay can provide substantial yield and profit benefits to subsequent wheat in seasons with low growing season rain.
Aim
To identify low risk, profitable break crops and end-uses for the Mallee region, and quantify their benefits to subsequent wheat crops.
Method
This field trial was set up in December 2008, 13km south east of Hopetoun on Warakirri’s Bullarto Downs property on two soil types 2.3km apart. A sand site with sandy topsoil and clay subsoil is located on top of an east-west dune and the clay site is a low-lying flat with clay loam topsoil and subsoil constraints.
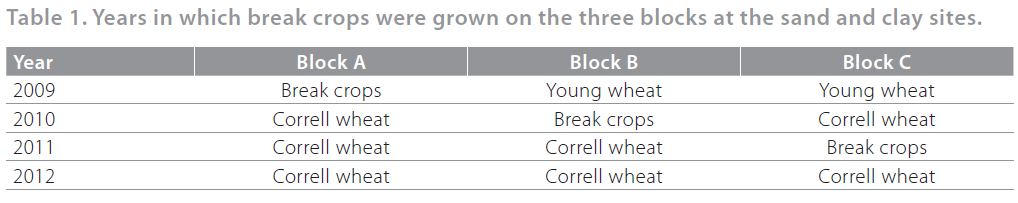
In December 2008, plots (2.1 x 28m) were pegged out in three separate areas using a split block randomised design. The first area (block A) was planted to break crops in 2009, followed by wheat in 2010, 2011 and 2012. The second area (block B) was sown to wheat in 2009, to break crops in 2010 and wheat in 2011 and 2012. The third area (block C) was sown to wheat in 2009 and 2010, to break crops in 2011 and to wheat in 2012 (Table 1).
Location: Hopetoun
Replicates: 4
Sowing date: 4 May
Target plant density: 130 plants/m²
Crop type: Correll wheat
Fertiliser: MAP + Zn (55kg/ha) (both sites at sowing)
Sand site: 9 July 41kgN/ha – Block A, B & C
14 Aug 19kgN/ha – Block A & B
Clay site: 9 July 41kgN/ha – Block A & B
14 Aug 19kgN/ha – Block C
Seeding equipment: knife points, press wheels, inter-row sown,
30cm row spacing
Growing season rain: 150mm
Summer rain (2011/12): 95mm
Two soil cores per plot (segmented into layers to a depth of 1.3m) were taken on 12 December 2011, 30 March 2012 and 4 December 2012. Plant available water (PAW) and mineral nitrogen were measured. Correll wheat (67kg/ha) was sown over the three blocks on 4 May 2012 and was machine harvested for yield. The grain was then analysed for quality (protein, moisture, test weight and screenings) on 29 December.
Gross margins were calculated for each crop and end-use for the years a break crop was grown, and for the wheat following the break crops. For 2009 hay and grain prices refer to BCG 2009 Season Research Results (pp. 39) and for 2010 prices refer to BCG 2010 Season Research Results (pp. 30).
In 2011 grain prices were assumed to be $438/t for canola, $271/t for peas and $144/t for AGP and $153/t for ASW. Hay prices were assumed to be $100/t for canola, $150/t for wheaten and pea hay and $200/t for vetch hay.
Grain prices used for 2012 were $288/t for H2 wheat, $273 for ASW and $223/t for feed. The variable costs used to calculate the gross margins include urea $620/t and MAP $780/t.
In 2011 canola at the clay site was badly damaged by hares and not harvestable. Gross margins assume that canola yielded 50% of wheat at that site in that year.
Results and interpretation
Effect of break crops on subsequent moisture
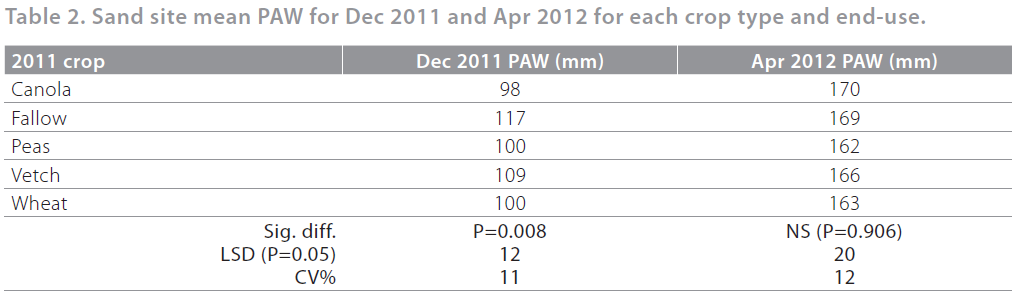
Soil PAW was influenced by break crops grown in 2011. Higher PAW was measured in December 2011 following fallow than vetch, peas, canola and wheat (Table 2). Cutting crops for hay also resulted in more PAW than grain (hay 109 mm, grain 100 mm, P=0.016). These effects did not carry through the relatively wet 2011/12 summer. At sowing time in 2012, there were no differences between crop types (Table 2) or end-use (grain 162mm, hay 170mm [P=0.2]) to the measured depth of 1.3m. However, it is likely that differences persisted below 1.3m and this may have influenced yield at this site. Wheat roots grow at an average rate of 12mm/day between sowing and anthesis, making final rooting depth for this crop approximately 1.7m.
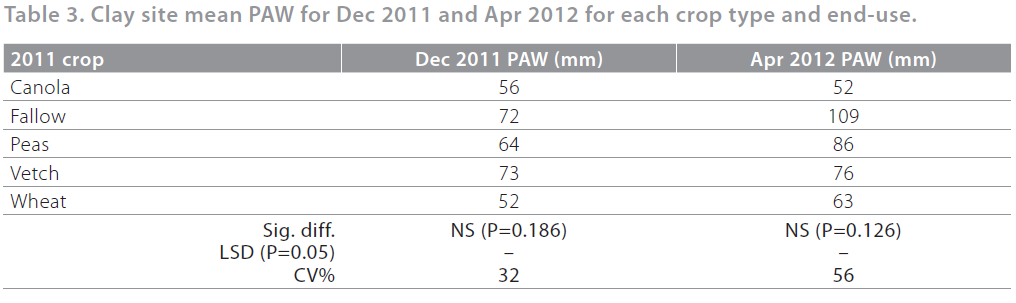
Break crops grown in 2011 at the clay site did not affect soil PAW at the end of the season. The hay and grain treatments resulted in no PAW differences so the average for each has been presented (Table 3). There were also no differences between end-uses and crop type in April 2012.
Break crop effect on wheat one year later
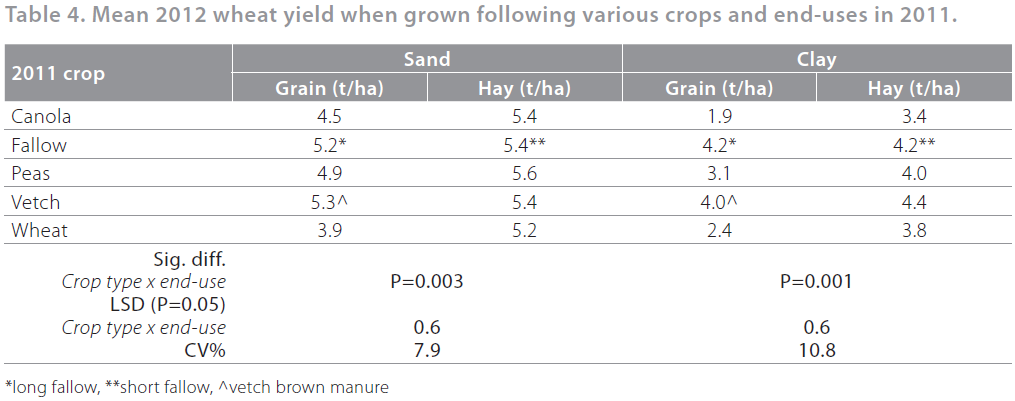
Break crop type and end-use in 2011 had an effect on wheat grain yield in 2012. Wheat yield increased when grown following canola, fallow, pea and wheat hay or vetch on the sand site; and following fallow, pea hay and vetch on the clay site (Table 4). Wheat also yielded more following canola, wheat and pea hay at the sand and clay sites, which was probably due to extra PAW from earlier termination of these crops.
Break crops effect on wheat two years later
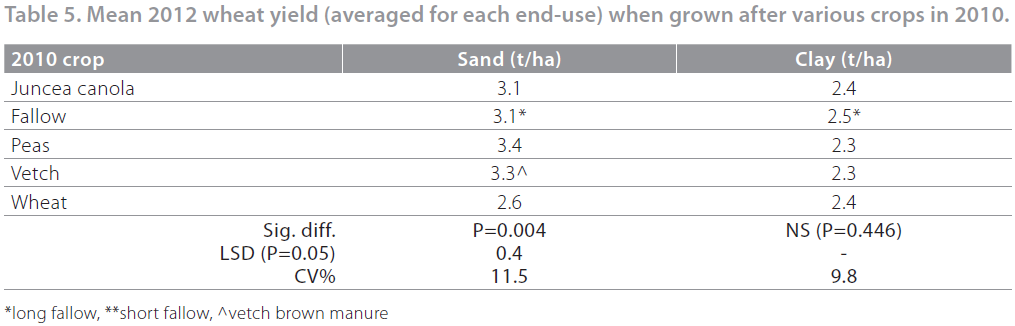
At the sand site, wheat yielded up to 0.7t/ha higher following juncea canola, peas, vetch and fallow (relative to wheat), but there was no effect of crop end-use on subsequent wheat yield. There was no effect of 2010 break crops or end-use on 2012 wheat yield at the clay site (Table 5).
Profitability of different crop sequences
At the sand site canola grain, vetch hay and pea hay followed by wheat were as profitable as continuous wheat (Figure 1). A break in the rotation using these crop types is more sustainable in terms of root and foliar diseases and herbicide resistance than continuous wheat. Wheaten hay followed by wheat grain was a profitable crop sequence at both sites. This was largely due to good hay prices in 2011, above average grain yields (thanks to extra PAW) and strong grain prices in 2012. At the clay site, all crop sequences were at least as profitable as wheat-on-wheat grain.

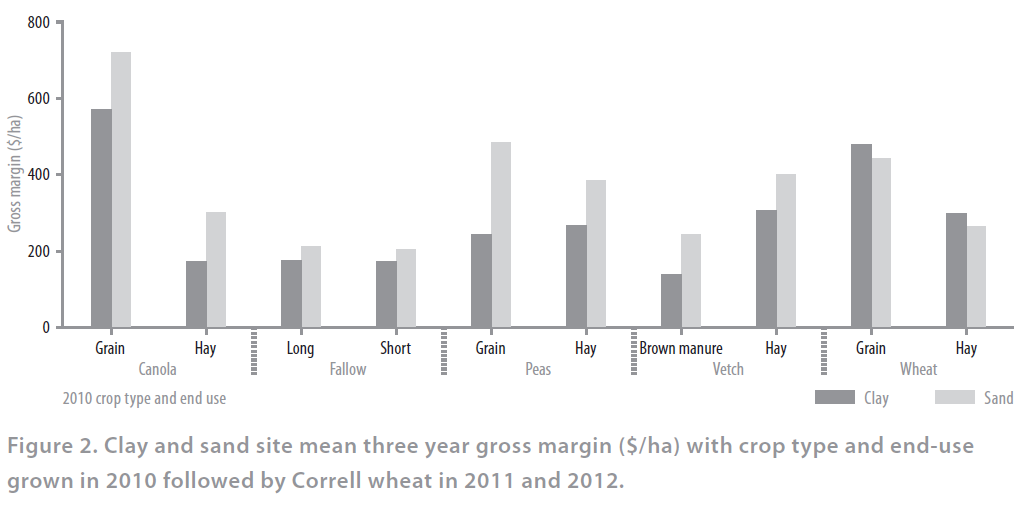
The average three year gross margin for both sites showed that only canola grain followed by wheat was more profitable than wheat-on-wheat (Figure 2). This was driven by strong canola prices and yields in 2010.
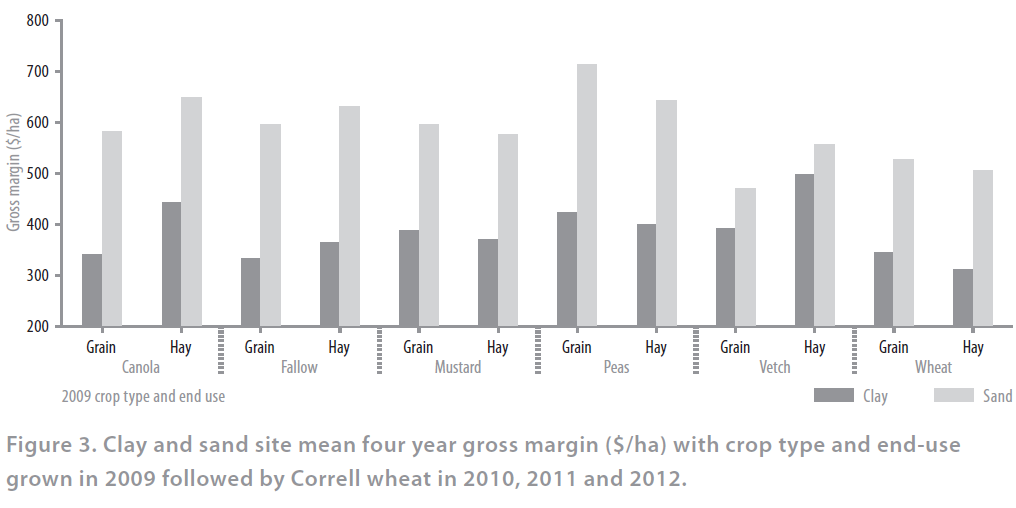
The four-year average gross margin shows that at the sand site all crop sequences except vetch brown manure were more profitable than wheat-on-wheat (Figure 3). At the clay site, all crop sequences except short fallow were more profitable than wheat-on-wheat.
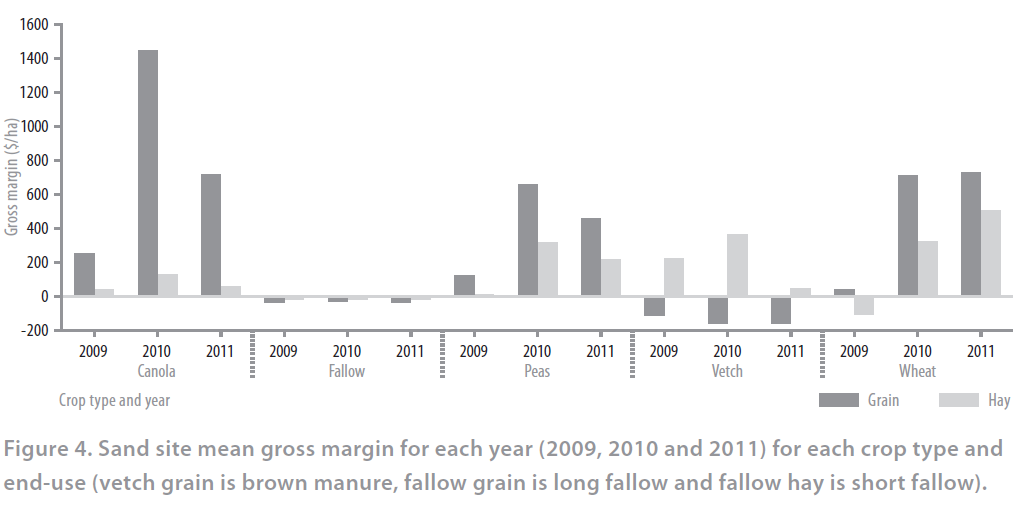
From 2009-2011 the break crops grown (excluding fallow and vetch brown manure) at the sand site have all been profitable (Figure 4). Profitable break crop options were still possible in 2009, which was a lower yielding season. Even though vetch brown manure and fallow were not profitable in the first year, there were benefits to wheat yield in the subsequent years and both of these provide exceptionally good non-selective grass weed control.
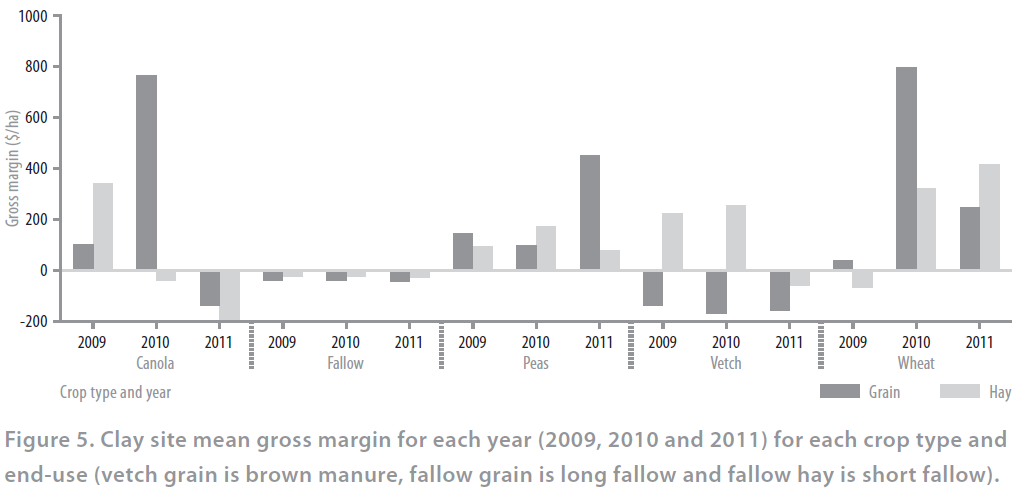
From 2009-2011, the clay site grew profitable break crops, although the break crop effect on subsequent wheat yield was less apparent. It should be noted however, that if disease and/or grass pressure become prevalent, then there are other break crop options which were profitable over the last three years (Figure 5).
Commercial practice
Wheat following broadleaf break crops was consistently as profitable (at least) as wheat-on-wheat in all years of the experiment. Crop sequences with a broadleaf break crop, particularly those brown manured or cut for hay, are also more sustainable in terms of herbicide resistance, root diseases and nitrogen inputs than continuous wheat. Crop sequences involving canola grain or vetch or pea hay were consistently profitable. Sequences with canola were largely profitable due to the high returns from canola itself, while crop sequences involving legume hay were profitable due to increased subsequent wheat yields.
Break crop choice and selection should be based on individual farm management and ability to manage the various break crop options in the rotation. If growers remain flexible in break crop and end-use decisions, and make suitable choices, risks associated with producing them can be greatly reduced.
AcknowledgmentS
This project was funded by GRDC project BWD00012 ‘Yielding benefits through partnerships’ and CPS00111 ‘Identifying farm scale opportunities to improve WUE: A nationally coordinated systems approach’.
Contributors include: Warakirri Bullarto Downs for hosting the experiments over five years; Ian Delmenico of CropRite Pty Ltd conducted the site EM survey; Damian Mowat and Brett Cox of CSIRO made soil water characterisations; John Stuchbery of JSA Independent for agronomic advice; Mel Cann of DPI Victoria for providing soil descriptions and Grant Hollaway made root disease assessments.
