Break crops have been shown to be a profitable option to include in crop rotations (BCG 2011 Season Research Results pp. 27). Previous work has focused on conserving soil moisture with different break crops and extra nitrogen (N) inputs for the following season due to certain break crops having the ability to fix N from the atmosphere. Some break crops (such as lupins and chickpeas) have been shown to adapt to low phosphorus (P) environments by producing root exudates that solubilise less available forms of P, making them more readily available for uptake. However, there has been limited assessment of the actual increases in available P generated by different crop types and whether this increase in P availability can actually be of benefit to subsequent crops.
The new and recently commercialised DGT (Diffusive Gradients in Thin-Film) soil P test has shown potential as an accurate assessment of P availability in a wide range of soil types. Most of the calibration data that exists for DGT has used wheat as the crop type. Two trials assessing other crop types and their comparative response to applications of P will add value to the new soil test interpretation. Yield assessments, together with extensive in-season soil sampling, will consolidate current critical DGT values for canola, lupins and chickpeas.
Take Home Messages
• Different crop types displayed varying phosphorus use efficiencies (soil and fertilizer
demand) under P deficient conditions.
• Crop types that have previously shown to be P efficient did not display the same traits
in neutral to slightly alkaline soils.
• Soil testing can have significant economic benefits if the right test is used.
Aim
To assess the soil and fertiliser (external) P requirements of different crop types in low P environments.
Results and interpretation
Soil test results
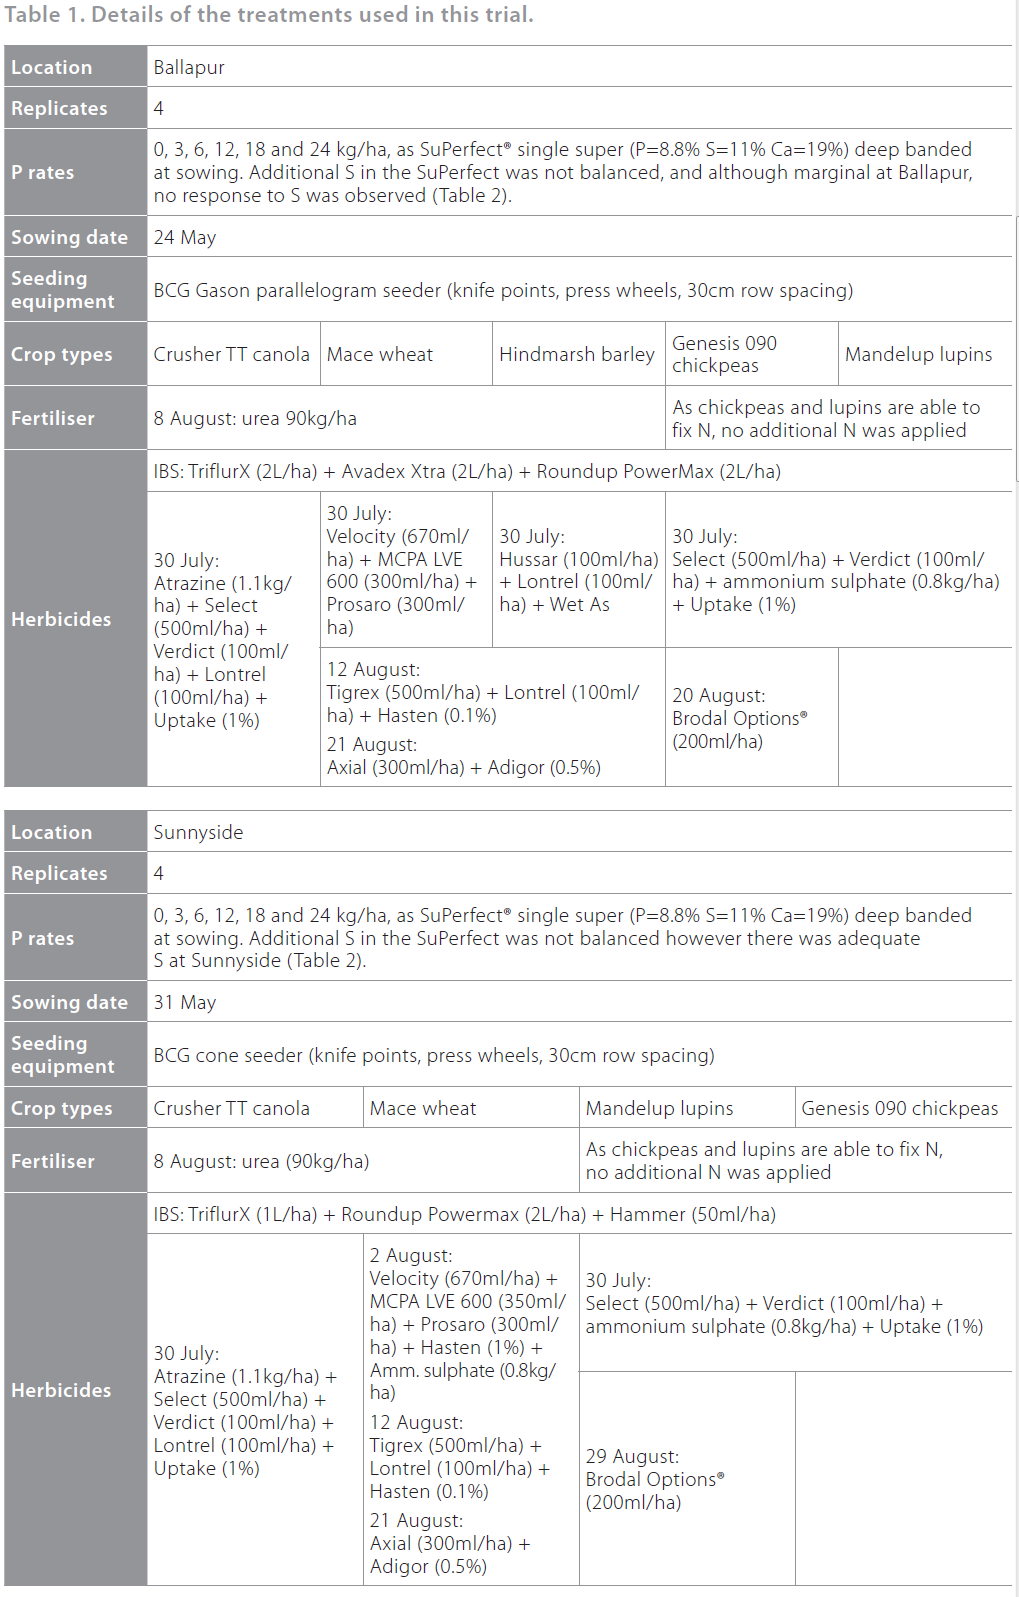
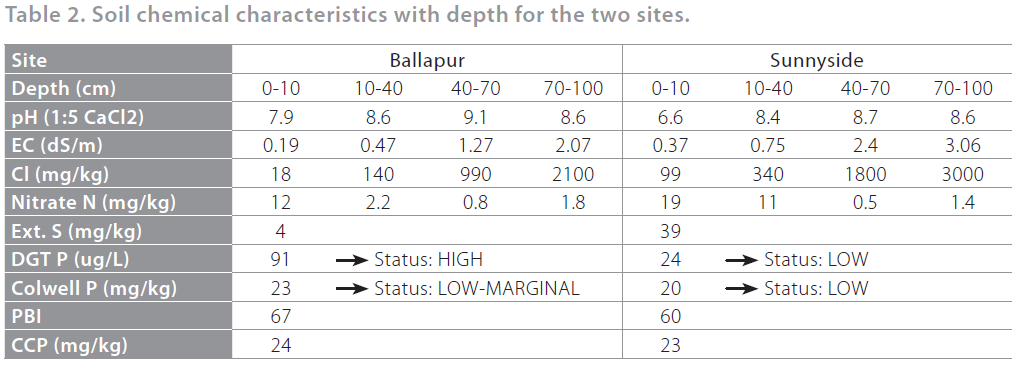
The salinity below 40cm is likely to negatively affect root growth (>1.0 dS/m) especially at the Sunnyside site (Table 2). Interpretation of initial DGT P results suggests a contrast between the two sites, with Sunnyside having low P status (DGT=24, critical=50, moderately responsive) compared with Ballapur (DGT=91, non-responsive). At both sites Colwell P (with PBI) are both slightly below critical values, suggesting marginal responses to P applications should occur (Table 2). This interpretation is based on datasets using wheat only.
Yield results
Sunnyside
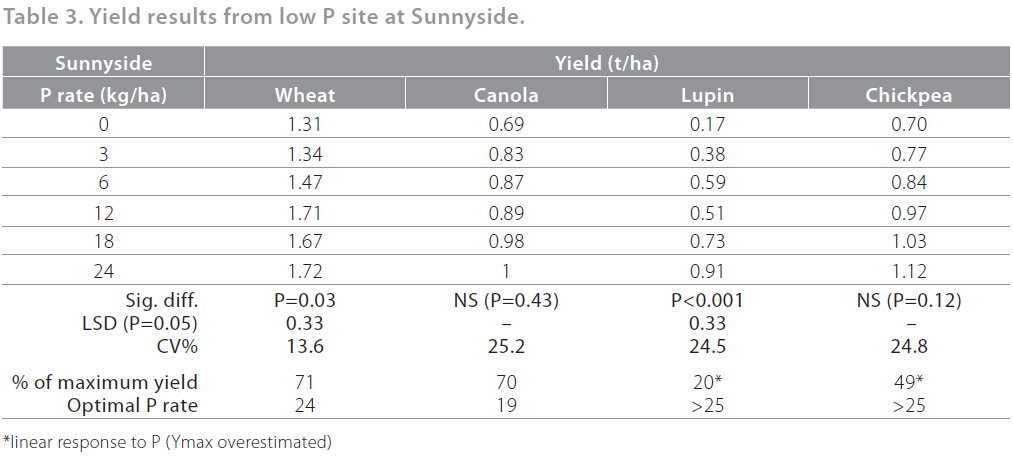
Significant responses to P application occurred for both wheat and lupins, while for canola and chickpeas the benefits were not sufficiently large to be significant (Table 3). In terms of external P requirements, canola was the most efficient, with 19kg P/ha maximising yield compared with 24kg P/ha for wheat and more than 25kg P/ha for lupin and chickpea (due to linear responses to P even up to application rates of 24kg P/ha). Both wheat and canola had similar magnitudes of overall response (control (0P) was 71 and 70% of achievable yield respectively) compared with lupins and chickpeas, which had larger increases to P applications (control was 20 and 49% of achievable yield respectively). These observations suggest that lupin and chickpeas were not more efficient than other crop types at using soil P reserves under P deficient conditions in neutral to slightly alkaline soil types.
Ballapur
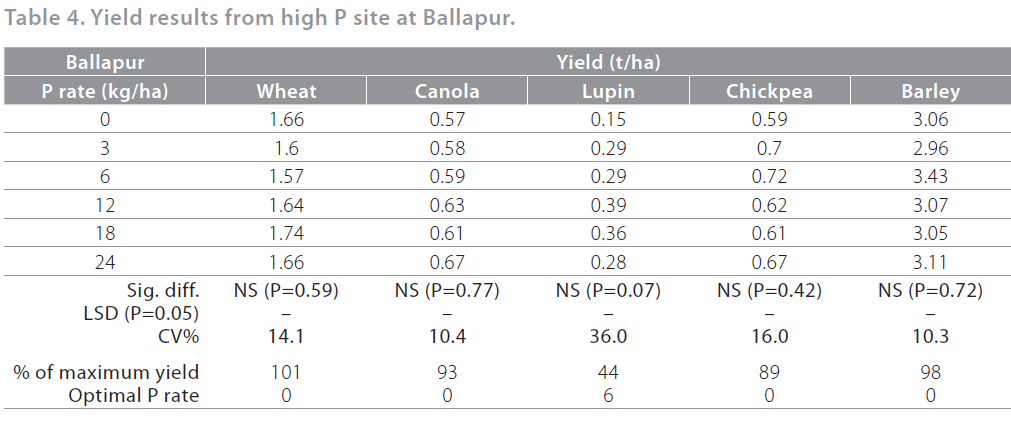
No significant responses to an application of P occurred at this site (Table 4): no comparisons between the efficiency of these crop types can be discussed without P uptake data. Lupins appeared to show yield benefits to P application, but this was not significant due to large site variability (CV=36%). The lupins were possibly affected by a combination of high pH, salinity and boron, as well as a later than ideal sowing date.
Soil test interpretation
For both sites, the Colwell P values were below the critical level (for wheat), as determined by PBI measurements. However, they were only one to three units below, suggesting marginal yield gains would be obtained with the addition of P fertiliser. The DGT P test results had more contrasting values between sites and correctly predicted the moderate response to P fertiliser at Sunnyside and the no-response at Ballapur.
Crop type and P economics
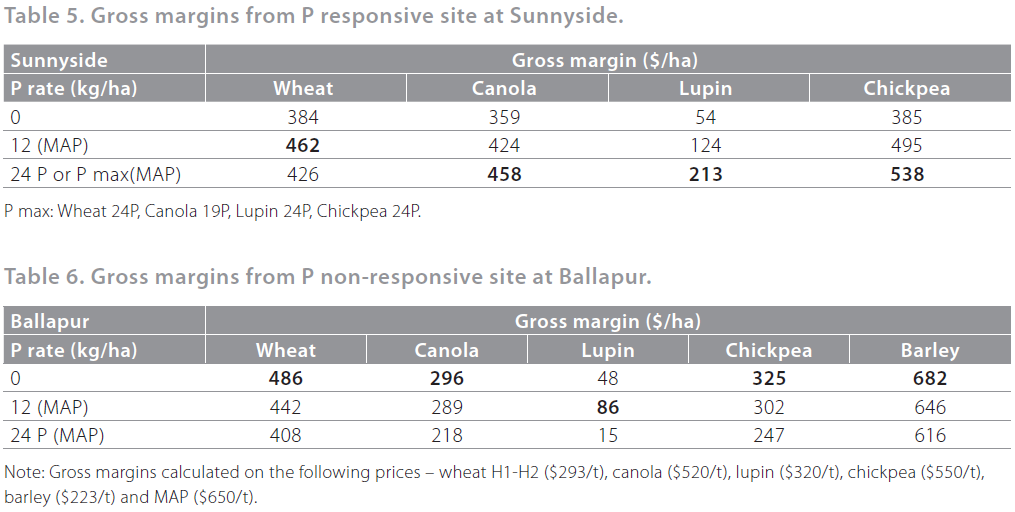
Gross margins calculated simply on yield responses and P input costs at both sites reveal the importance of correctly diagnosing P deficiency and applying sufficient P. On the assumption that P deficiency was corrected, chickpeas had the highest gross margin of all crops at Sunnyside, closely followed by wheat and canola (Table 5). The best gross margin outcomes occurred at the lowest P application rates, supporting low risk strategies of P maintenance rates (e.g. 10kg P/ha). However, on a P deficient site, significant gains could be achieved with higher application rates (e.g. lupins at Sunnyside). The main driver of optimal gross margins on a deficient site with a reasonable yield potential is associated with the increase in yield due to P application and not the cost of applying P. On the non P responsive site at Ballapur, the greatest returns were associated with no P application due to the lack of response to P (Table 6). It should be noted that in a P sufficient scenario, it may be possible to reduce P rates, but it is important that levels are carefully monitored. In terms of different crop types, the highest-yielding barley had the greatest gross margin followed by wheat, canola, chickpeas and lupins.
Where to next?
Both of these sites will be sown to wheat in 2013 without any additional application of P, in order to assess the soil P benefits of these break crops to the following wheat phase.
At the time of writing this article, the crop P contents and in-season soil test results had not been collated and therefore could not be discussed here. It is anticipated that P balances will be calculated at the completion of these trials.
Commercial practice
Phosphorus nutrition will always be an important aspect of farm nutrient management. The P demand and efficiency of different crop types and benefits to subsequent crops will be assessed in the 2013 growing season.
Results from 2012 trials suggest that break crops can offer a viable alternative to cereals as long as the P status is correctly evaluated.
Acknowledgments
This project was funded by GRDC (project code UA00119).
